
Overview & Concepts
The XY Plot object in EasyBuilder Pro is used to display the relationship between two variables on a graphical chart. Unlike standard trend displays that plot a value over time, an XY plot displays one variable on the horizontal axis (X-axis) and another variable on the vertical axis (Y-axis). This allows the HMI to visualize how one process value changes relative to another.
In an XY plot, each point on the graph represents a pair of values taken from two registers. As the values change, the plotted points update to reflect the relationship between the two variables.
Key characteristics of an XY plot include:
- The X-axis represents one measured value or parameter
- The Y-axis represents a second value related to the first
- Data points are plotted as coordinate pairs based on register values
Typical uses of XY plots include:
- Comparing two related process measurements
- Visualizing system performance relationships
- Displaying calibration curves or performance graphs
By plotting one variable against another, the XY Plot object helps operators and engineers better understand relationships between process values and observe patterns that may not be visible in time-based trend displays.

Implementation
Click [Object] » [Chart] » [XY Plot] icon on the toolbar to open a [XY Plot] object property dialog box.
General Tab
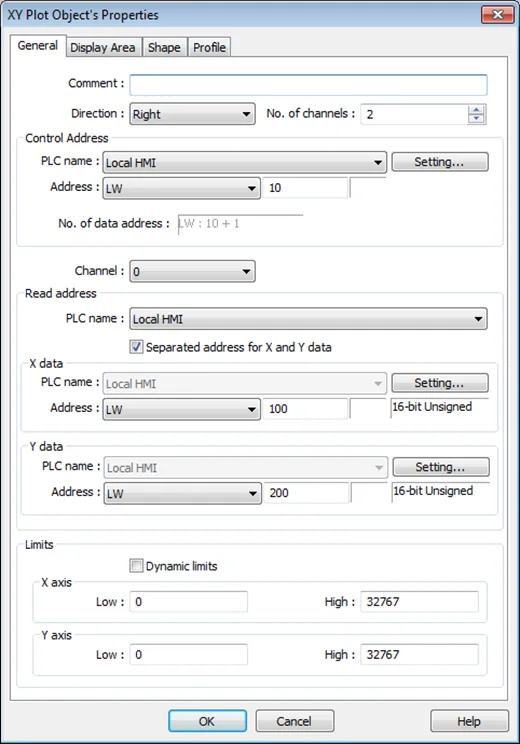
| Setting | Description |
|---|---|
| Direction | There are four selections, right, left, up or down. |
| No. of channels | Set the number of channels for observation. |
| Control address | Controls the operation of all channels simultaneously. When the [Control address] is LW-n, assigning values to LW-n will issue commands to XY plot according to the table below. Meanwhile, LW-n+1 controls the number of data points plotted. After operation, the [Control address] will be reset to 0. Control Address: Value: Result LW-n: 1: Plots point on XY curve (previously plotted points are retained) LW-n: 2: Clears all XY curves LW-n: 3: Clears existing XY curves, then plots new XY curve LW-n+1: Any number: Controls the number of data points plotted No. of data address Controls the number of data points. Each channel can plot up to 1023 points. |
| Channel | Select a channel to configure. |
| Read Address | Device Select a PLC which will be the source of [X data] and [Y data] and designate a read address. The format of the data register blocks used for the display channels depends on whether [Separated address for X and Y data] and/or [Dynamic limits] has been selected. See Example 1, below |
| Dynamic limits | When not selected (See Example 2) The Low and High limits can be set by entering constants. The Low and High limits are used for calculating X and Y range in percentage. When selected (See Example 3) A zoom effect can be created by changing the Low / High Limits. |
Limits Examples
Example 1
The format of the data register blocks used for the display channels depends on whether [Separated address for X and Y data] has been selected, and if [Dynamic limits] has been selected.
The following explains the situations where 16-bit register is used:
- If [Separated address for X and Y data] is not selected, and set [Read address] to LW-n:
With Dynamic Limits Selected
With Dynamic Limits NOT selected
| X data | Y data | X data | Y data | |
|---|---|---|---|---|
| Low Limit | LW-n | LW-n+2 | Constant | Constant |
| High Limit | LW-n+1 | LW-n+3 | Constant | Constant |
| 1st data | LW-n+4 | LW-n+5 | LW-n+0 | LW-n+1 |
| 2nd data | LW-n+6 | LW-n+7 | LW-n+2 | LW-n+3 |
| 3rd data | LW-n+8 | LW-n+9 | LW-n+4 | LW-n+5 |
| 4th data | LW-n+10 | LW-n+11 | LW-n+6 | LW-n+7 |
- If [Separated address for X and Y data] is selected, and set [X data] to LW-m, [Y data] to LW-n:
With Dynamic Limits Selected
With Dynamic Limits NOT selected
| X data | Y data | X data | Y data | |
|---|---|---|---|---|
| Low Limit | LW-m+0 | LW-n+0 | Constant | Constant |
| High Limit | LW-m+1 | LW-n+1 | Constant | Constant |
| 1st data | LW-m+2 | LW-n+2 | LW-m+0 | LW-n+0 |
| 2nd data | LW-m+3 | LW-n+3 | LW-m+1 | LW-n+1 |
| 3rd data | LW-m+4 | LW-n+4 | LW-m+2 | LW-n+2 |
| 4th data | LW-m+5 | LW-n+5 | LW-m+3 | LW-n+3 |
Example 2
When [Dynamic limits] is not selected, the Low and High limits can be set. The Low and High limits are used for calculating X and Y range in percentage.

If [Separated address for X and Y data] is not selected and the address is LW-n, the corresponding limits are retrieved from the addresses as shown in the following table.
| Data format | 16-bit | 32-bit | 64-bit (cMT / cMT X only) |
|---|---|---|---|
| X axis low limit | LW-n | LW-n | LW-n |
| X axis high limit | LW-n+1 | LW-n+2 | LW-n+4 |
| Y axis low limit | LW-n+2 | LW-n+4 | LW-n+8 |
| Y axis high limit | LW-n+3 | LW-n+6 | LW-n+12 |
Example 3
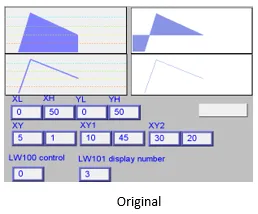
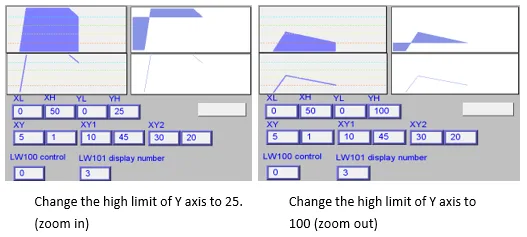
If [Dynamic limits] is selected, a zoom effect can be created by changing the setting of Low / High Limits.
In the following example, XL=X low limit, XH=X high limit, YL=Y low limit, YH=Y high limit, and XY, XY1, XY2 are three XY data. When changing the high limits of X and Y axis, the result is shown below:
Notes:
- X and Y data can be set to different formats. For example: If X data uses 16-bit unsigned, Y data uses 32-bit signed, please note the address setting.
- When using a Tag PLC, such as AB tag PLC, X and Y must be in the same format. When using different formats a warning will be shown.
Display Area Tab
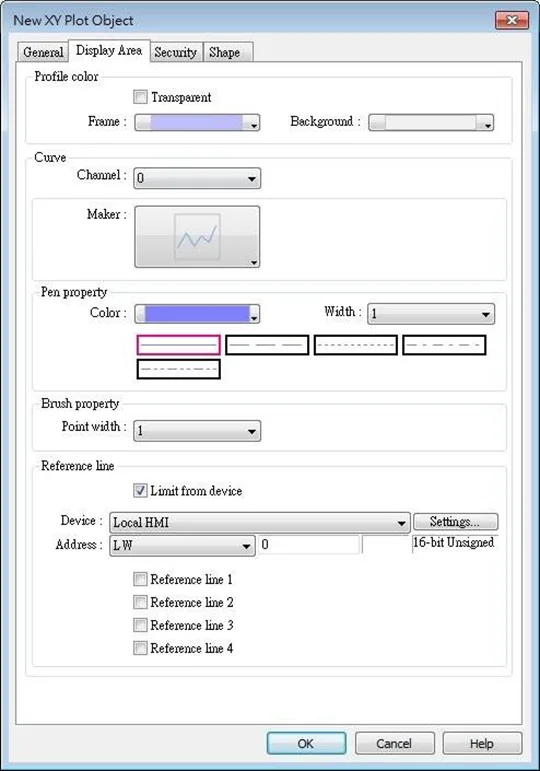
| Setting | Description |
|---|---|
| Profile color | Select the color of the frame and the background, or select [Transparent] check box to hide the frame and background. |
| Curve | For each channel select the properties of color, width, and line style. |
| Maker | Select the style of XY Plot. For cMT / cMT X Series, there are different types of XY plot available in the drop-down |
| Pen property | Select color, width and style for the line in XY plot. |
| Brush property | Select point width. |
| Reference line | Up to 4 horizontal reference lines can be shown on the graph. Fill in high, low limits and Y axis percentage values. Different colors can be selected for each reference line. If [Limit from PLC] is selected, designate a register to be the read address of reference line. |
Example 4
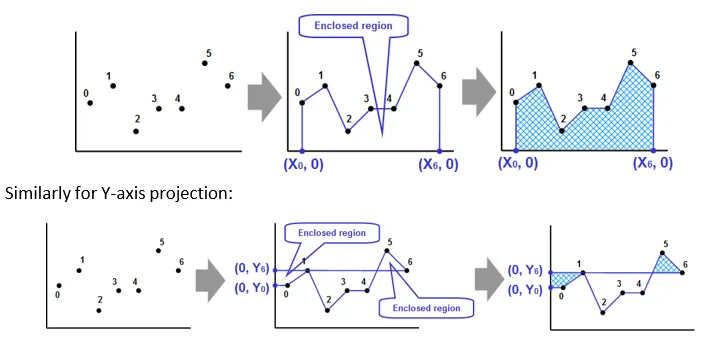
The curve shown in the following figure is drawn with 7 points numbered from P0 to P6. The steps the system draws the X-axis Projection are:
- Calculates the two points in X-axis – (X0, 0) and (X6, 0).
- Link all the points in the order of (X0, 0), P0… P6, (X6, 0) and returns to (X0, 0) at last.
- Fill out all enclosed areas.
Note:
- Without clearing the drawn points, XY Plot can be drawn a number of times by entering value 1 in the control address repeatedly. The way to calculate the maximum number of times is: 32 divided by the number of channels.
- 1 channel => 32 times
- 2 channels => 16 times
- 16 channels => 2 times