
Overview & Concepts
The Energy Monitoring feature in EasyBuilder Pro allows the HMI to display and track electrical energy data from connected power meters or monitoring devices. By reading measurement registers such as voltage, current, power, and accumulated energy, the HMI can present this information to operators for real-time monitoring and analysis.
Energy monitoring is configured by linking the HMI to an energy meter and mapping the registers that contain the electrical measurements. The HMI can then display this information and use it with logging or historical functions to observe energy usage over time. Typical uses include monitoring machine power consumption, tracking facility energy usage, and identifying trends in electrical demand.

Implementation (Demand Setting)
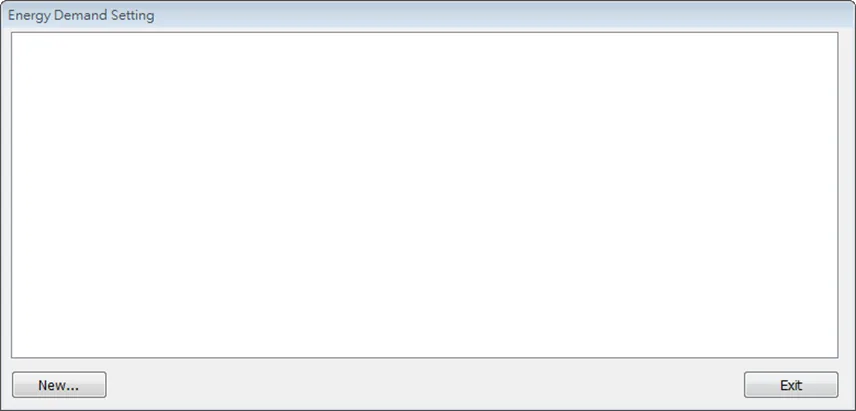
Click [Data/History] and then click [Demand Setting] to open the settings dialog box. Configure General and Demand Threshold settings and click OK; an Energy Demand Setting object will be created.
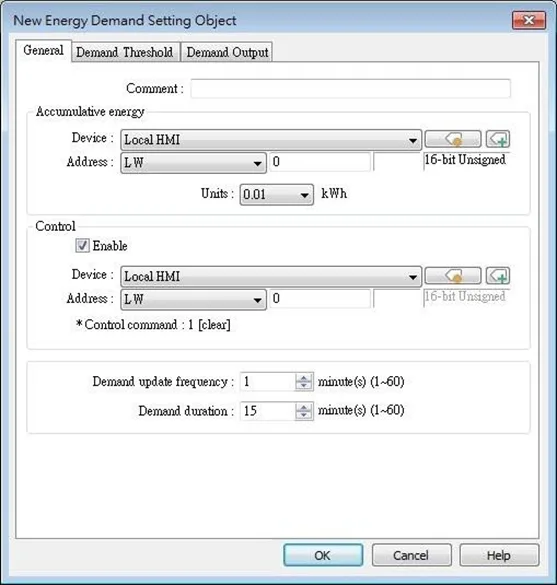
General Tab
| Setting | Description |
|---|---|
| Accumulative energy address | This address records energy consumption. The unit can be 0.1/0.01/0.001 kWh (kilowatt-hours). |
| Control | Giving control command 1 in the designated address can clear the energy consumption record. |
| Demand update frequency | The frequency to record energy consumption, the range is from 1 to 60 minutes. |
| Demand duration | The frequency to calculate energy demand. The range is from 1 to 60 minutes. |
Note:
- Demand Duration (T) must be an integral multiple up the Demand Update Frequency (t).
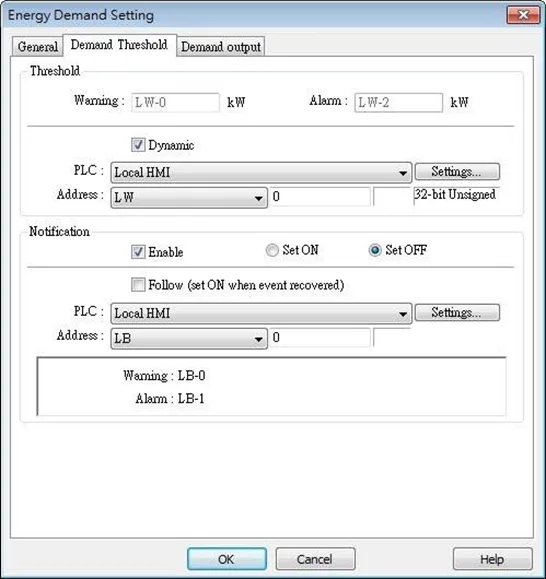
Demand Threshold Tab
| Setting | Description |
|---|---|
| Threshold | When the values in the specified addresses reach the values specified in Warning and Alarm fields, the warning and alarm will be triggered. The threshold limits can be dynamically changed at runtime. |
| Notification | When the estimated energy demand reaches the threshold limit, the status of the specified bit address will change accordingly. |
| Follow | If selected, when the estimated energy demand falls less than the threshold limit, the status of the notification bit address will return to its original state. |
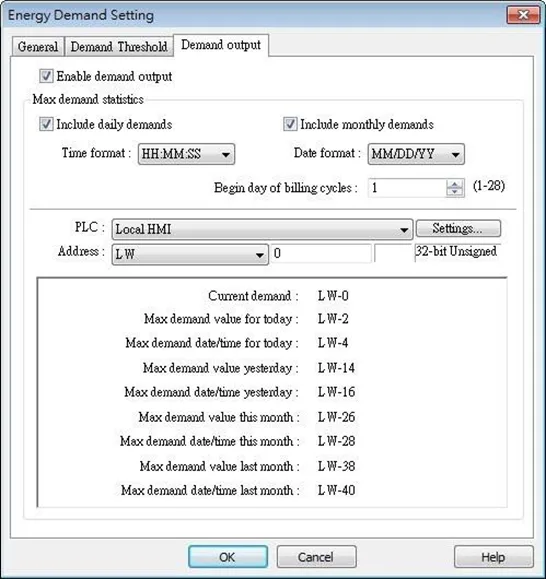
Demand Output Tab
| Setting | Description |
|---|---|
| Enable demand output | Opens [Max. demand statistics] settings. |
| Max demand statistics | The maximum energy demand of today/yesterday, and current month/last month, can be recorded in the corresponding addresses. The time/date format, and the beginning day of the billing cycle, can be specified. |

Implementation (Demand Display)
Energy Demand Display object graphs the result from Energy Demand Setting object at runtime. The font, grid and watch line style can be specified, and the threshold limits can be shown in the graph.
Click [Data/History] and then click [Demand Display] to open the settings dialog box. Configure the attributes and click OK; an Energy Demand Display object will be created.
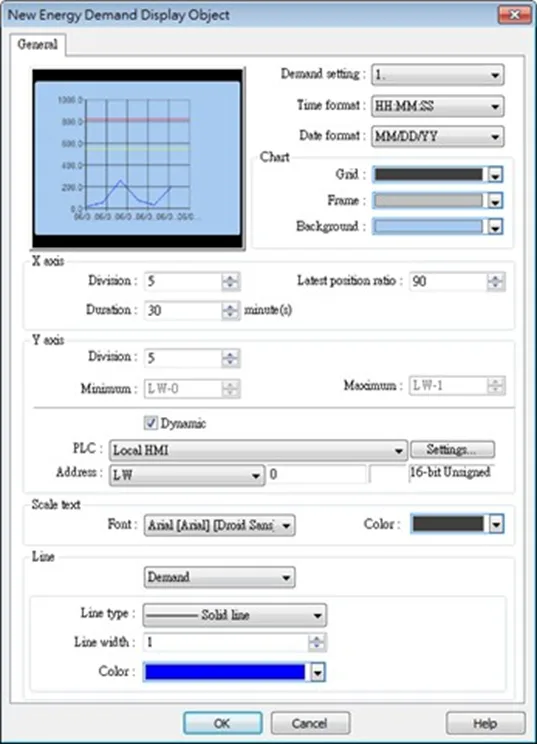
| Setting | Description |
|---|---|
| Object index | Select an existing Energy Demand Setting object as the data source of Energy Demand Display object. |
| Time/Date format | Set Time and Date format. |
| Chart | Set the colors of Grid, Frame, and Background. |
| X axis | Set the number of divisions and time duration on the X axis. Latest position ratio: The ratio represents a position along the X axis, where 50% represents the middle and 100% represents the right end. This field sets the position to mark the latest data, and the acceptable range is: 50%~100%. |
| Y axis | Set the number of divisions, maximum and minimum scale values on the Y axis. The limits can be changed dynamically at runtime. |
| Scale text | Set the font and color of the scale text. |
| Line | Three watch lines marking Demand, Alarm, and Warning can be shown. The type, width, and color of the lines can be customized. |
Example
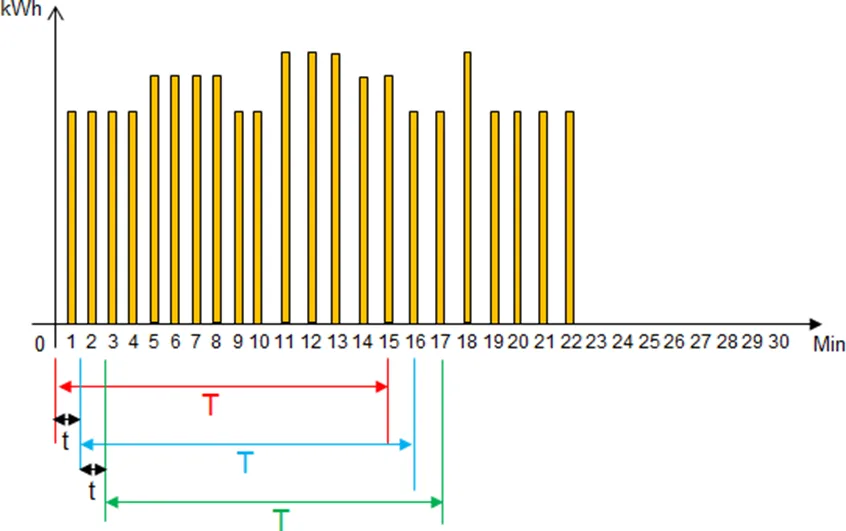
- As shown in the above figure, when t=1, the frequency to record energy consumption will be once per minute. When T=15, each 15 minutes the sum of the energy consumption measured every minute (t=1) will be calculated.
- From the 1st to the 15th minute (red zone), the energy consumption measured each minute will be added up to get the total sum. The total sum times 4 (15 minutes is a quarter of an hour) to obtain a value (kWh) indicating the estimated energy demand.
- From the 2nd to the 16th minute (blue zone), the energy consumption measured each minute will be added up to get the total sum. The total sum times 4 (15 minutes is a quarter of an hour) to obtain a value (kWh) indicating the estimated energy demand.
- From the 3rd to the 17th minute (green zone), the energy consumption measured each minute will be added up to get the total sum. The total sum times 4 (15 minutes is a quarter of an hour) to obtain a value (kWh) indicating the estimated energy demand.
- The Energy Demand Display object will graph the estimated energy demand.
- If t=3 and T=15, the estimated energy demand will be: Sum of the latest 5 records (15/3=5) times 4 (15 minutes is a quarter of an hour).
- If t=5 and T=30, the estimated energy demand will be: Sum of the latest 6 records (30/5=6) times 2 (30 minutes is half an hour).