
Overview & Concepts
The Alarm and Event features in EasyBuilder Pro are used to monitor system conditions and notify operators when defined states occur. It allows the HMI to observe register values from PLC devices or Local HMI memory and generate alarm or event records when configured conditions are met. These records can then be displayed, acknowledged, and stored for later review, helping operators respond quickly to machine conditions while maintaining a history of system activity.
An alarm or event is configured by defining several key elements that determine when it occurs and how it is handled by the system. These include:
- The register or bit being monitored (PLC or Local HMI memory)
- The comparison condition that determines when the alarm or event is triggered
- The message text that will be displayed to the operator
- The priority level used to classify the severity of the condition
- Optional acknowledgement behavior and logging settings
When the defined condition becomes true, the HMI generates an alarm or event entry. Alarms typically represent abnormal conditions that may require operator acknowledgement, while events are generally used to record system actions or state changes without requiring acknowledgement. Both can be displayed through objects such as Alarm Display, Alarm Bar, or Event Display, allowing operators to view active conditions in real time.
In addition to real-time notification, alarm and event information can be recorded and stored for historical reference. This enables the system to maintain a record of machine faults, operator interactions, and process state changes. These records can be reviewed directly on the HMI or exported through other project features for analysis, maintenance review, or compliance documentation. By linking machine conditions to operator messages and historical logging, the Alarms and Events system provides structured monitoring and traceability within an HMI project.

Implementation: Event (Alarm) Log
The Event (Alarm) Log is the object where all the alarms and events are defined within the project. From this point on, we will refer to this log as simply the Event Log, because an alarm is a type of event.
The overview of Event Log:
- Define the Event content and trigger condition
- Trigger event according to the condition
- Save the event log to the specified device
- View the Event using the relevant objects (Alarm Bar, Alarm Display, Event Display) according to desired viewability
Event Log Management & Configuration
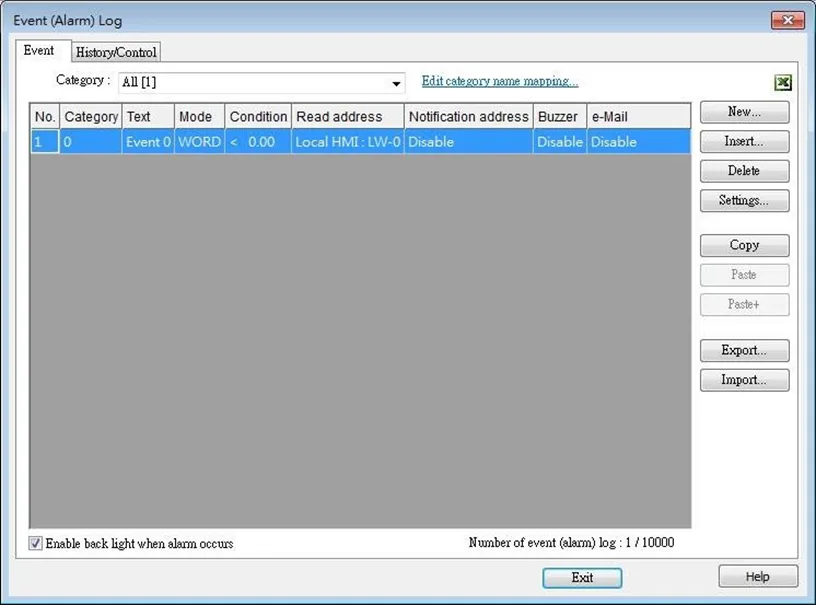
Click [Data/History] » [Event (Alarm) Log] icon on the toolbar to open the property dialog box. Set up the properties, and a new Event condition will be created.
| Setting | Description |
|---|---|
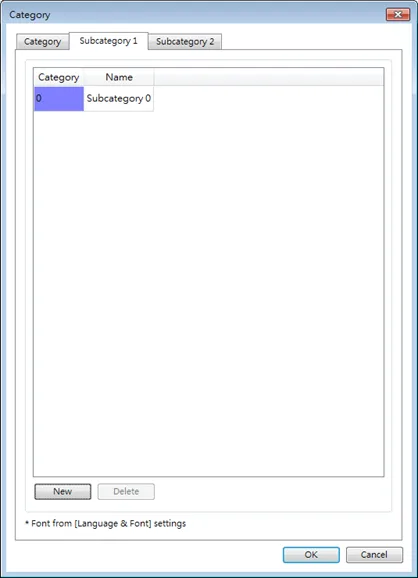
| Category | Classifies events by dividing them into 0 ~ 255 categories. Select one category to add or view event log. The number of events in this category is shown in the bracket “[ ]”. Edit category name mapping… Opens a category name table which allows editing corresponding category names. Subcategories can also be added in this table in addition to the exiting categories. The maximum allowable number of entries in each subcategory is 256 (0~255) entries. |
| Copy | Copies the selected item |
| Paste | Overwrites the selected items with the clipboard contents |
| Paste + | Appends the clipboard contents to the end of the list |
| Setting | Description |
|---|---|
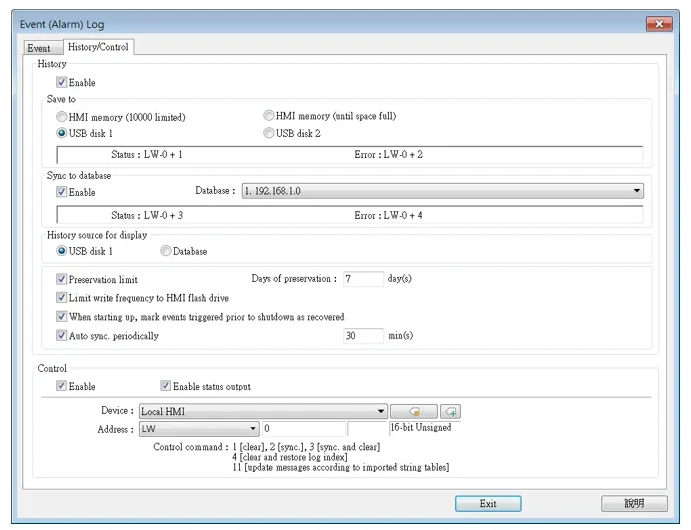
| History | Saves the Event Log data to HMI memory (10000 limited or until space full), SD card, USB disk, or database (by synchronizing Event Log file to database server). The rules of saving the data are: ▪ When [HMI memory (10000 limited)] is selected, and the number of events reaches 10000, the system will delete the earliest 1000 events on HMI and keep on saving the data to HMI memory. ▪ When [HMI memory (until space full)] is selected, the system will keep on saving data to HMI memory, in this case, the data may not be synchronized to database server. When the cMT / cMT X HMI memory storage is full, the system will delete the earliest 1000 records and keep on saving data to HMI memory. ▪ When USB disk or SD card is selected, and the number of events reaches 10000, the system will automatically save the data to the external device and delete the earliest 1000 events on HMI. ▪ To synchronize the data to database server, select a database that has been configured before. ▪ If the external device already contains some events, the new data is appended without overwriting the original data each time in synchronization. ▪ When the external device is removed from HMI, or HMI is disconnected from database server, if the connection is recovered before the number of events exceeds 9000, the events occur during disconnection will be saved to HMI. If the number of events exceeds 9000 during disconnection, the earlier data will be deleted, and cannot be synchronized by recovering connection. |
| History source for display | Event Log displays the history data read from the designated source. |
| Preservation limit | This setting determines the maximum number of Event Log files to be preserved in HMI memory. This does not include the file generated today. That is, if [Days of preservation] is set to 2; the two latest files excluding the file generated today will be kept. The files that are not within the range will be deleted automatically. The system checks the time of the files and deletes earlier files only during synchronization. |
| Limit write frequency to HMI flash drive | When enabled, the system will store operation logs on the HMI at intervals of 10 seconds. To prevent the loss of operation log data between two storage actions caused by power-off, EasyBuilder Pro provides the system register LB-9034. By sending an ON signal to this register, the system will initiate a data storage process. |
| When starting up, mark events triggered prior to shutdown as recovered | When enabled, the system will automatically recover events triggered before shutdown. Range: The last 10,000 events stored in the HMI memory. |
| Auto sync. periodically | Data will be automatically synchronized to the designated external device in the specified time interval, regardless of the rules explained above. Unit: Minute(s) Range: 1~1440 |
| Control address | If select [Enable] check boxes under both [Control address] and [History files], entering a specific value in the control address sends the corresponding command. Control Register Value 1: Clear Event Log on HMI Control Register Value 2: Synchronize event log to external device Control Register Value 3: Synchronize event log to external device and then clear event log on HMI Control Register Value 4: Use the history data stored in USB disk/SD Card/Database after changing HMI Control Register Value 6: Free unused sotorage space reserved for event logs (.db). This command can be used when historical data is saved to HMI memory (until space full) Control Register Value 11: Update event log message contents by reading a new String Table Control Register Value 12: Reset the event occurrence count displayed in the Event Display and Alarm Display. This is effective only when the event does not have the [Read and reset occurrence] address enabled. |
| Status Error | When LW-n is used as the control address, the four consecutive addresses following LW-n (LW-n+1~LW-n+4) will show status and error, please see the prompt in the settings dialog box. |
| Value | Status address: LW-n+1 and LW-n+3 |
|---|---|
| 0 | Disconnected from external device or database |
| 1 | Connecting with external device or database |
| 2 | Connected with external device or database |
| 3 | Storing records into the archive. When this is done, the value returns to 2. |
| Value | Error address: LW-n+2 and LW-n+4 |
| 0 | None |
| 1 | Unknown error |
| 2 | Failed to connect with external device or database |
| 3 | Access denied |
| 4 | Wrong database name |
| 5 | Inconsistent data format |
| 6 | Failed to open table |
| 7 | Failed to create table |
| 8 9 | Failed to write table Failed to open database |
| 10 | Database is corrupted |
Notes:
- Before removing SD card / USB disk, or disconnecting from database server, please synchronize event log data by using control address.
- When monitoring multiple HMIs by using cMT Viewer, the Start Button on the current HMI screen may flash to indicate that an error has occurred on another HMI that is also being monitored, reminding the user to switch HMI and check the event.
- The [When starting up, mark events triggered prior to shutdown as recovered] option does not apply to events stored in the HMI memory exceeding 10,000 entries.
Excel Editing
Click on the Excel icon in Event Log setting dialog box to open the Excel template for a reference of editing. This template is under the installation directory, the file name is EventLogExample.xls. This template includes the ready-made dropdown lists and validation mechanism.

Notes:
- [System tag] and [User-defined tag] cannot be set to true simultaneously, otherwise, the system will view the User-defined tag to be a System tag, and [User-defined tag] to be false. If setting [Device type] to [User-defined tag], please set [System tag] to false.
- When setting [User-defined tag] to true, if the system compares the [Device type] with the user-defined tag in the system, and no suitable tag is found, the system will set the [User-defined tag] in event log to false
- [Color] format is R:G:B, each should be an integer form 0 to 255.
- Before importing Label Library / Sound Library, please make sure the library names exist in the system.
Quick Viewing of Errors
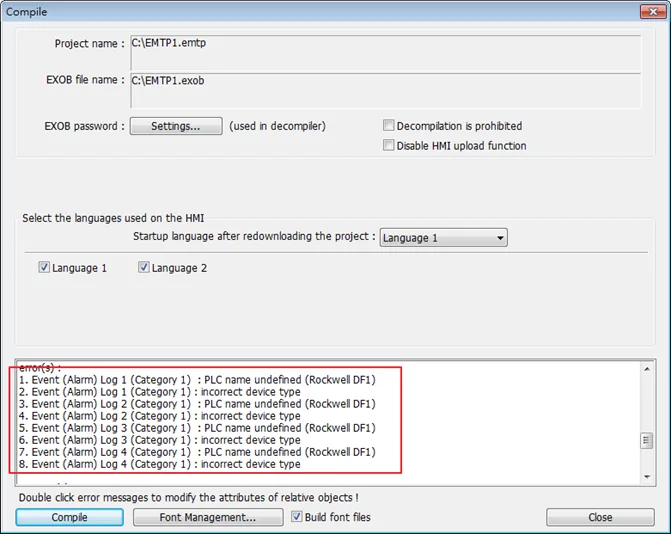
When compiling the project, the errors in Event Log will be displayed in the Compile window. To open Event Log and view the errors, double click on the item in the Compile window.
Creating New Event Log Entry
Click [New] in the [Event (Alarm) Log] dialog box.
General Tab
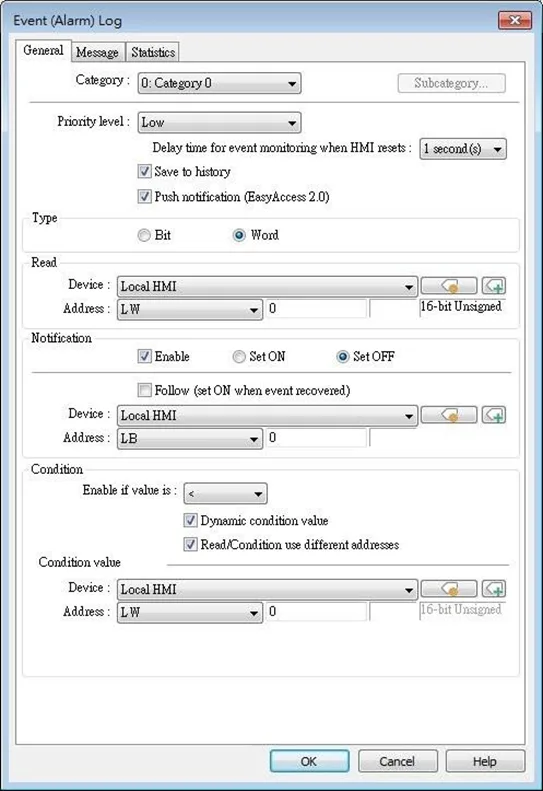
| Setting | Description |
|---|---|
| Category | Select event category, the range is from 0 to 255. |
| Subcategory | Add this Event Log into the subcategories in the category mapping table. |
| Priority level | Events in Alarm Bar / Alarm Display are ordered by priority level first and then by time. |
| Save to history | In Event Log main settings, if [Save to HMI memory] check box under [History files] group box is selected, selecting [Save to history] here determines whether each separate event should be saved as historical file. |
| Push notification (EasyAccess 2.0) | When an event occurs, EasyAccess 2.0 push notifications can be sent to iOS®/Android® devices. |
| Delay time for event monitoring when HMI resets | This feature is used to set the delay time of Event Log after HMI reboot, in order to avoid false alarm that occurs upon HMI reboot due to uninitialized values. This feature is often used with [Dynamic condition value]. The delay time only occurs once upon HMI reboot. |
| Read address | The system reads data from this address to check if the event matches the trigger condition. |
| Notification | When enabled, the system will set the specified address ON or OFF when the event is triggered. Follow The notification bit will reset to its original state once the alarm condition returns to normal. For example, when the alarm is triggered, the state of the notification bit turns ON. When the alarm condition returns to normal, and [Follow] check box is selected, the state of the notification bit turns OFF. |
| Condition | When [Bit] is selected, Event Log will detect the state of a Bit address. When [Word] is selected, Event Log will detect the value of a Word address to check if it is greater than, less than, or equals to a specified value. See Example 1 and Example 2. Dynamic condition value Allows online change of the comparison value for trigger condition when the condition is a Word address type. If [Read/Condition use different addresses] is not selected, the source of condition value will be the next consecutive address from [Read address]. Read/Condition use different addresses Allows selecting the Word address type to be the source of condition value. |
Examples
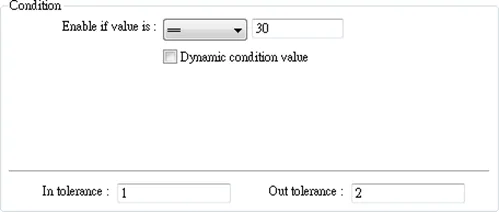
The setting above indicates:
- When [Read address] value is greater than or equals to 29 (= 30 – 1)
- Or less than or equals to 31 (= 30 + 1), the event will be triggered.
The trigger condition: 29 ≤ [Read address] value ≤ 31
After the event is triggered, when [Read address] value is greater than 32 (= 30 + 2) or less than 28 (= 30 – 2) the system will return to normal condition:
[Read address] value < 28 or [Read address] value > 32
Note the In and Out Tolerance settings. If you wanted to have a condition triggered EXACTLY and specifically based on a precise value (no tolerance), change the value of the relevant tolerance to 0
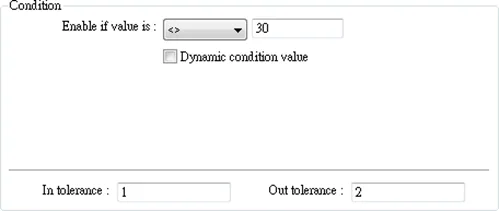
The setting above indicates:
- When [Read address] value is less than 29 (= 30 – 1)
- or greater than 31 (= 30 + 1), the event will be triggered.
The trigger condition: [Read address] value < 29 or [Read address] value > 31
After the event is triggered, when [Read address] value is greater than or equals to 28 (= 30 – 2) or less than or equals to 32 (= 30 + 2) the system will return to normal condition:
28 ≤ [Read address] value ≤ 32
Message Tab
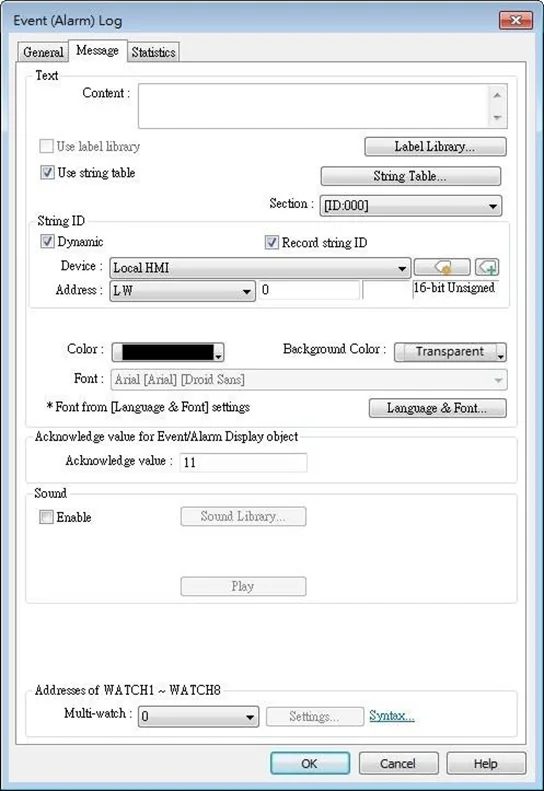
| Setting | Description |
|---|---|
| Content | The text content displayed in [Alarm Bar], [Alarm Display], and [Event Display] objects. Use the formats in the following two examples of WATCH addresses to use register data in content. The content in Label Tag Library and String Table can be used in the Event Log message. |
| String ID | [Event Display] and [Alarm Display] objects display messages according to the String ID in the designated register. Record String ID With this option selected, when an event occurs, the string’s ID number will be recorded. Message of the event triggered before can be retained. |
| Font / Color / Background color | The font / color / background color can be set respectively for each event. The font and color settings determine how [Alarm Bar] shows the text, while The font, color, and background color settings determine how [Alarm Display] and [Event Display] show the text. These settings are not available in the [Event Display] under History mode. |
| Write value for Event/Alarm Display object | When an event in the [Event Display] or [Alarm Display] object is acknowledged, the acknowledge value is written to the specified [Acknowledge] address. This feature can be used with an Indirect Window object’s read address so that when the acknowledge value is written, a window pops up as a prompt about how to handle the alarm. |
| Sound | If enabled, the selected sound will be played when an event is triggered. Continuous beep can also be enabled, which only stops when the event is acknowledged or recovered. For continuous beep, a delay time can be set between triggering the alarm and the start of beeping. |
| Address of WATCH 1~8 | Users can set how the value is displayed in the designated watch address when an event occurs. Up to 8 watch addresses can be used simultaneously. Click [Syntax] to see how to use the syntax to embed device data in the _content of an event log displayed in the watch address. |
E-Mail Tab
Please enable this function in [System Parameter Settings] » [e-Mail] first.
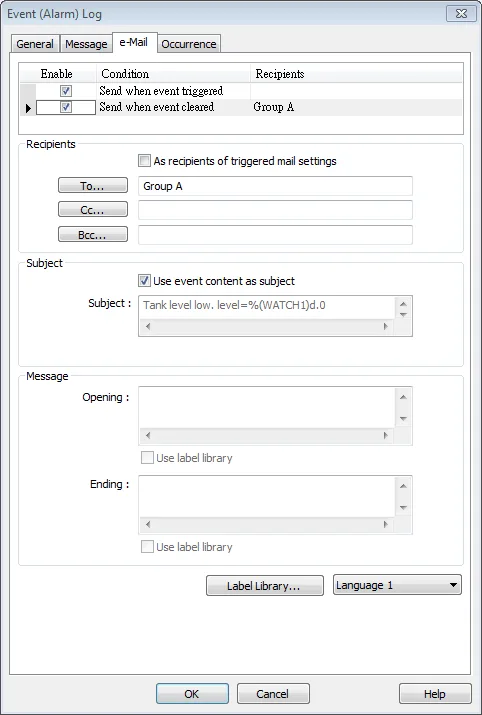
| Setting | Description |
|---|---|
| Recipients | Select the [To], [Cc], and [Bcc] recipients. |
| Subject | Enter the subject of the e-mail. |
| Message | Enter the [Opening] and [Ending] content of an e-mail. |
| Attach | If the [Contains a screenshot of window] check box is selected, the screenshot of the selected window will be attached |
Note:
The Priority level of an event determines its importance in e-mail delivery:
| Event Priority Level | Email Importance |
|---|---|
| Emergency | High |
| High / Normal | Normal |
| Low | Low |
Statistics Tab
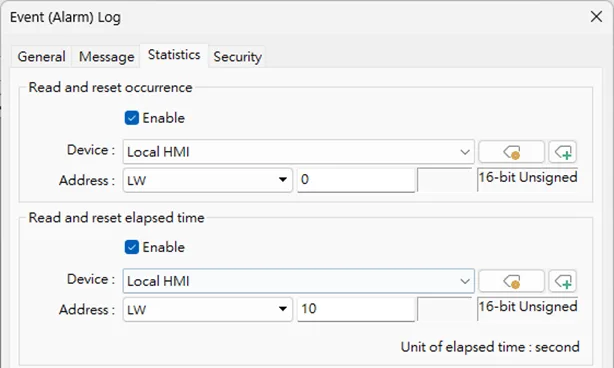
| Setting | Description |
|---|---|
| Read and reset occurrence | If enabled, the number of occurrence of the event after HMI startup will be written to the designated word address. The word address can be read / written. |
| Elapsed time read and reset address | If enabled, from an event occurs to its recovery, the elapsed time (in seconds) will be written to the designated word address. The word address can be read / written. |
Security Tab
With security settings enabled, an address and a condition can be set so that an event is recorded only when the state of the specified address meets the preset condition.
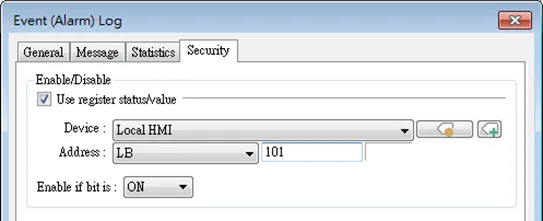
With the [Use register status/value] option enabled, an event will be recorded only when the state of the specified address meets the preset condition.
Notes:
- When an event is triggered with the security settings enabled, the event can be acknowledged on Event Display or Alarm Display even when the security settings are disabled after the event is triggered.
- With security settings enabled, the event’s address will not communicate with the device if the preset condition is not met.
Implementation: Event and Alarm Display Methods
Once an event condition is created, it can be easily displayed within one or more of the three display methods in EasyBuilder Pro:
- Alarm Bar
- Alarm Display
- Event Display
Each of the display methods behave differently, enabling the programmer to custom define the methodologies of displaying the different events.
Alarm Bar and Alarm Display objects are used to display alarm messages which are defined in Event (Alarm) Log objects. When the trigger conditions are met, events or alarms will be displayed as they occur in chronological order in Alarm Bar or Alarm Display object.
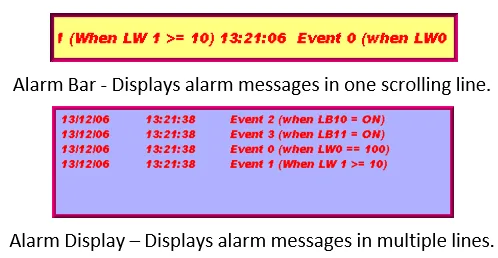
Alarm Bar scrolls all alarm messages in one single display line, whereas Alarm Display shows alarm messages in multiple lines.
The Event Display object displays events from the Event (Alarm) Log that meet the specified trigger conditions. These displayed events can be sorted based on time, occurrence count, or priority level. The Event Display object provides information about the events, including the trigger date / time, acknowledge time, recovered time, message, occurrence count, elapsed time, priority level, category, and subcategory. Furthermore, it is capable of displaying multi-lined messages as well.
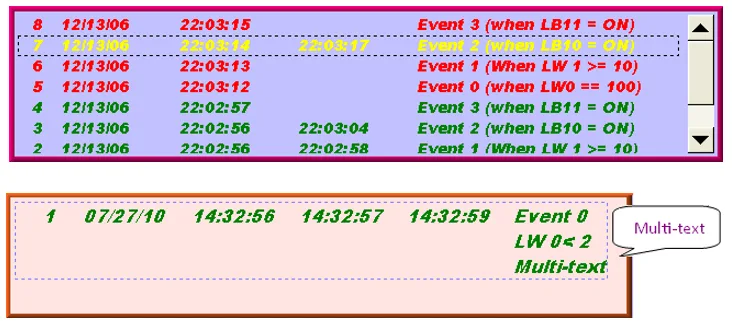

Alarm Bar
Click [Data/History] » [Alarm Bar] icon on the toolbar to open the object property dialog box. Set up the properties, press OK button, and a new object will be created.
Alarm Tab
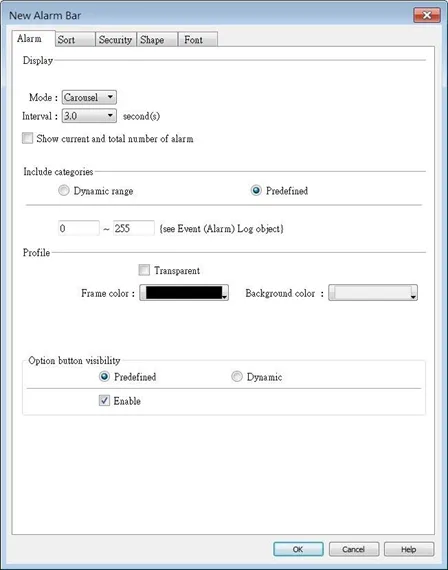
| Setting | Description |
|---|---|
| Display | Display settings are only available for Alarm Bar. The available modes are [Carousel] and [Marquee]. When [Carousel] mode is selected, the option to display the current and total alarm count and set the interval in seconds can be enabled. When [Marquee] mode is selected, the speed of text movement in the Alarm Bar object can be adjusted. Enabling multi-line display allows the event content to be shown in multiple lines within the Alarm Bar object. Please consider the performance impact when using this mode. |
| Include categories | Events in the selected category will be displayed. The categories are set in Event (Alarm) Log object. For example, if the category is set to “2 to 4” here, only events in categories 2, 3, 4 will be displayed. For more information, see “7 Event Log”. cMT / cMT X Series Dynamic Category Range is an option available only for cMT Series models. With this option selected, an address can be designated for dynamically selecting event categories to be displayed. |
| Caption | Caption settings are only available for Alarm Display on cMT / cMT X Series. |
| Option button visibility (cMT / cMT X Series) | Show or hide the option button Predefined Select [Enable] to show the option button. Dynamic Designate a bit address to control option button visibility. |
Sort Tab
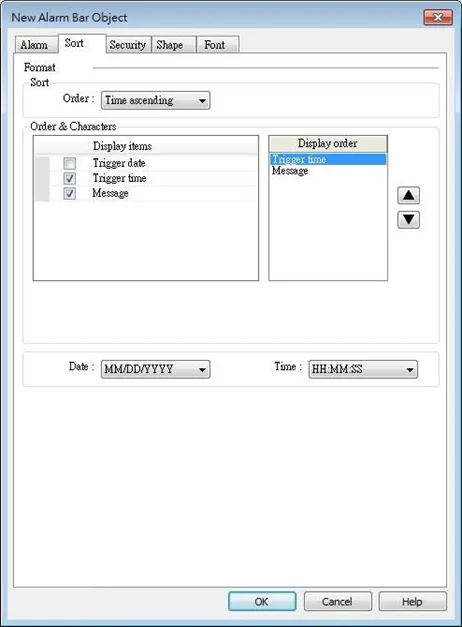
| Setting | Description |
|---|---|
| Order | Time ascending Latest event is placed last in the list (the bottom). Time descending Latest event is placed first in the list (the top). |
| Display order | Select the items to be displayed and use the up and down arrow buttons to adjust the display order of the alarms. |
| Date | Displays the date tag with each alarm message. The four formats of date tag: MM/DD/YY, DD/MM/YY DD/MM/YY YY/MM/DD |
| Time | Displays the time tag with each alarm message. The four formats of time tag: HH:MM:SS HH:MM DD:HH:MM HH |
Title Tab
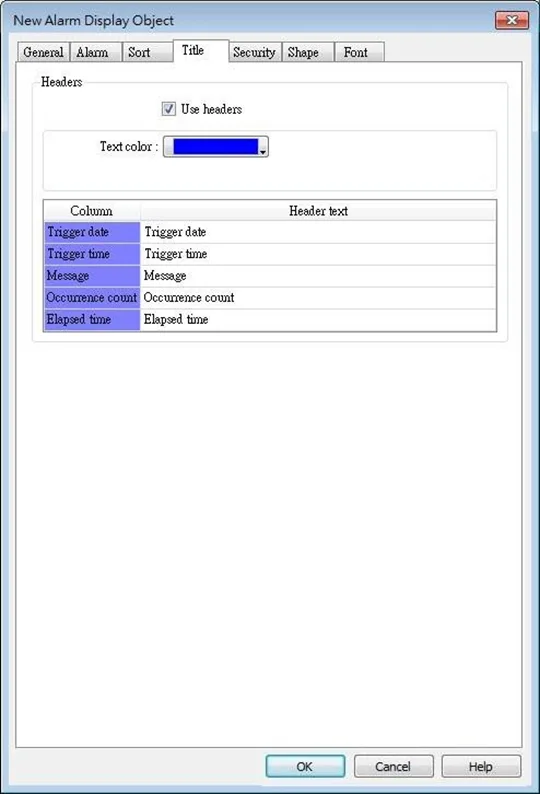
With [Use headers] selected, the text color and column headers can be configured.
Security Tab
| Setting | Description |
|---|---|
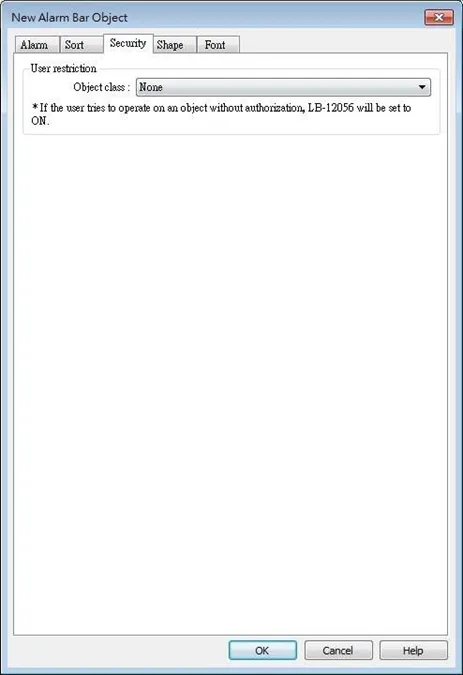
| Interlock | When [Use interlock function] check box is selected, whether the object is operable is determined by the state of a designated Bit address. As shown in the above settings, if LB-0 is ON, the object is operable. Hide when disabled When the designated Bit is OFF, the object will be hidden. |
| User restriction | Set the security class of the object to be operated by an authorized user. Object class “None” means any user can operate this object. Only account “admin” can operate “Administrator” object class. Make invisible while protected When the user’s privilege does not match the object class, the object will be hidden. When this check box is deselected in Alarm Display object settings, the unauthorized user can see the Alarm Display object, but cannot trigger the object or make any change. This check box is greyed out in Alarm Bar object settings. |
Font Tab
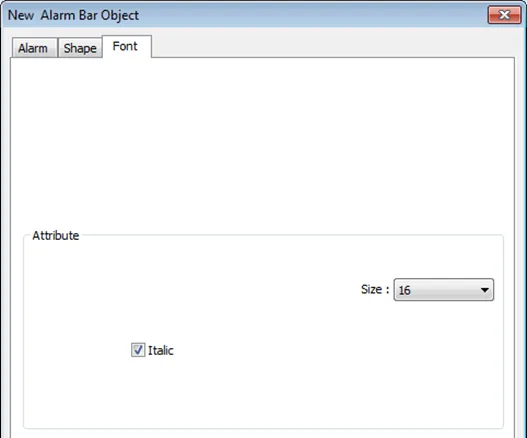
The font, color, and content of the alarm messages displayed in Alarm Bar and Alarm Display objects are set in Alarm (Event) Log object:


Alarm Display
Click [Data/History] » [Alarm Display] icon on the toolbar to open the object property dialog box. Set up the properties, press OK button, and a new object will be created.
General Tab
| Setting | Description |
|---|---|
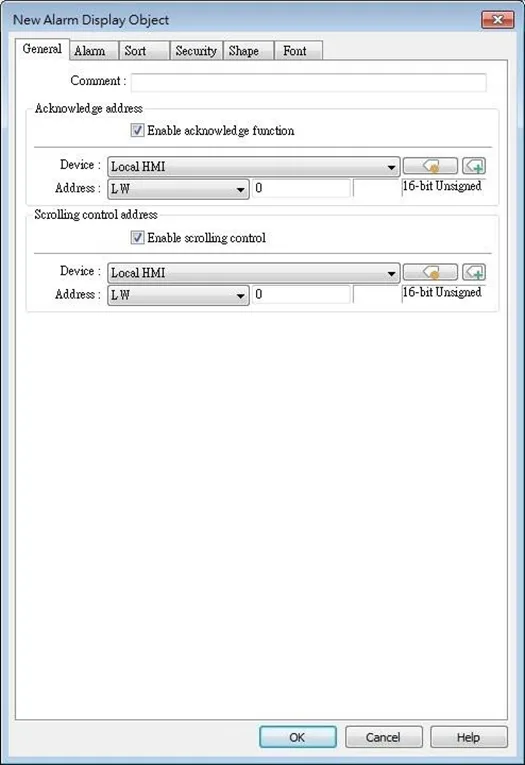
| Enable acknowledge function | If selected, the [Acknowledge value] selected for the associated event, specified in Alarm (Event) Log » Message tab will be written to the [Acknowledge address] designated in Alarm Display. [Insert image here] |
| Scrolling control address | If enabled, the value in the designated control address indicates the number of lines to be scrolled down. The minimal value is 0, which indicates the first line. Please note that with this address enabled, the horizontal and vertical scroll bars will not be available on the object; please make sure that the width of the object is enough for completely showing the content. |
Notes:
- When using a cMT / cMT X Series model, press and hold the event on the screen to acknowledge an event; drag a finger on the screen to scroll.
- When using a cMT / cMT X Series model, a default minimal row height exists in Alarm Display objects that have enabled Acknowledge function. The minimal row height prevents the rows to be touched by mistake. On a small-sized HMI, the row height may be slightly taller when Acknowledge function is enabled.
Alarm Tab
| Setting | Description |
|---|---|
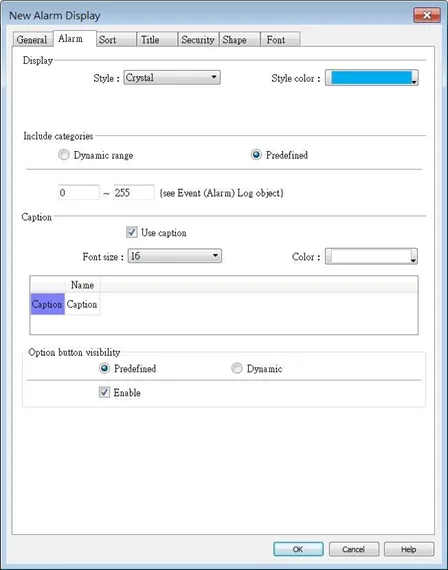
| Include categories | Events in the selected category will be displayed. The categories are set in Event (Alarm) Log object. For example, if the category is set to “2 to 4” here, only events in categories 2, 3, 4 will be displayed. cMT / cMT X Series Dynamic Category Range is an option available only for cMT Series models. With this option selected, an address can be designated for dynamically selecting event categories to be displayed. |
| Caption | Caption settings are only available for Alarm Display on cMT / cMT X Series. |
| Option button visibility | Show or hide the option button Predefined Select [Enable] to show the option button. Dynamic Designate a bit address to control option button visibility. |
Sort Tab
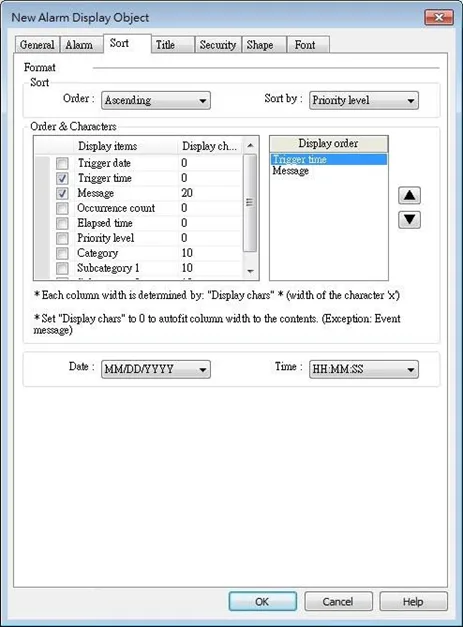
| Setting | Description |
|---|---|
| Order | Sort By: Ascending – Priority Level (cMT / cMT X Series) Event with highest priority level is placed last in the list (the bottom) Descending – Priority Level (cMT / cMT X Series) Event with highest priority level is placed first in the list (the top) Ascending – Occurrence Count Event with highest occurrence count is placed last in the list (the bottom) Descending – Occurrence Count Event with highest occurrence count is placed first in the list (the top) Time ascending Latest event is placed last in the list (the bottom). Time descending Latest event is placed first in the list (the top). |
| Display order | Select the items to be displayed and use the up and down arrow buttons to adjust the display order of the alarms. |
| Date | Displays the date tag with each alarm message. The four formats of date tag: MM/DD/YY DD/MM/YY DD/MM/YY YY/MM/DD |
| Time | Displays the time tag with each alarm message. The four formats of time tag: HH:MM:SS HH:MM DD:HH:MM HH |
Title Tab
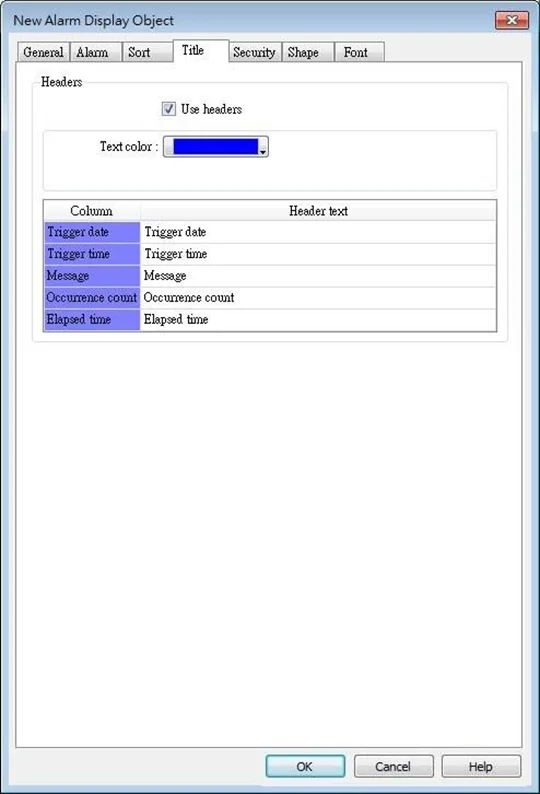
With [Use headers] selected, the text color and column headers can be configured.
Security Tab
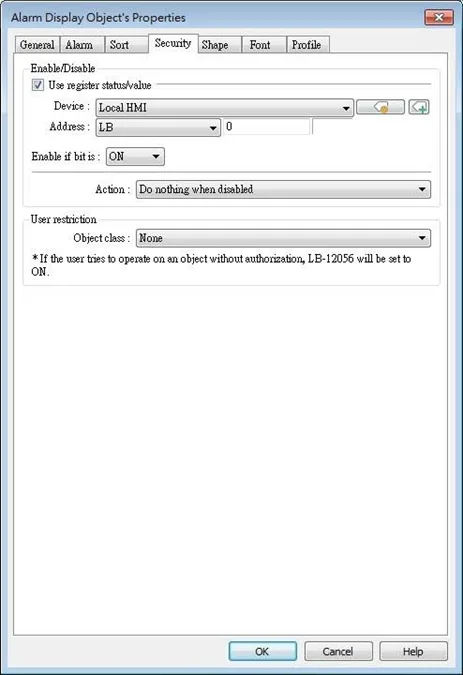
| Setting | Description |
|---|---|
| Interlock | When [Use interlock function] check box is selected, whether the object is operable is determined by the state of a designated Bit address. As shown in the above settings, if LB-0 is ON, the object is operable. Hide when disabled When the designated Bit is OFF, the object will be hidden. |
| User restriction | Set the security class of the object to be operated by an authorized user. Object class “None” means any user can operate this object. Only account “admin” can operate “Administrator” object class. Make invisible while protected When the user’s privilege does not match the object class, the object will be hidden. When this check box is deselected in Alarm Display object settings, the unauthorized user can see the Alarm Display object, but cannot trigger the object or make any change. This check box is greyed out in Alarm Bar object settings. |
Font Tab
Set the font size or select [italic].
The font, color, and content of the alarm messages displayed in Alarm Bar and Alarm Display objects are set in Alarm (Event) Log object:

Event Display
Click [Data/History] »[Event Display] icon on the toolbar to open an Event Display object property dialog box. Set up the properties, press OK button, and a new Event Display object will be created.
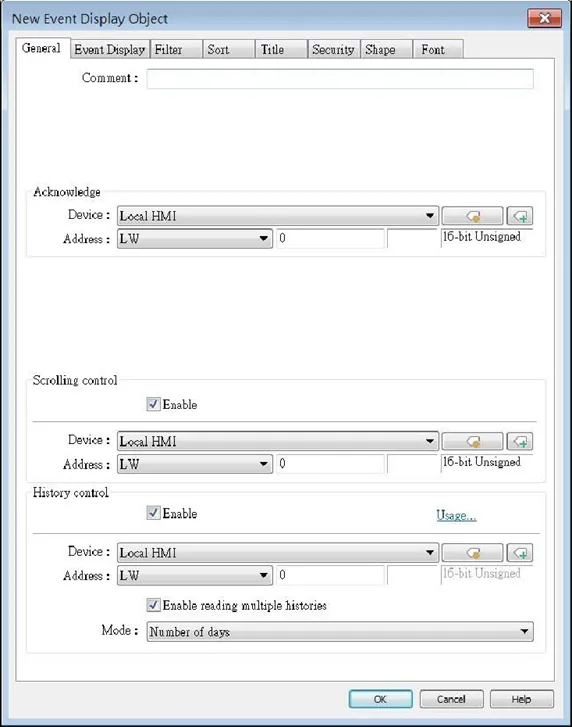
For cMT / cMT X models, only events with “save to history” option selected in the Event (Alarm) Log settings can be displayed in the Event Display object. The events that are not set to be saved in the history can be displayed using the Alarm Bar or Alarm Display object.
| Setting | Description |
|---|---|
| Acknowledge | When an event is acknowledged, the value specified in the Acknowledge Value field under the Message tab of the Event (Alarm) Log settings will be outputted to the Acknowledge address of the Event Display object. |
| Scrolling control address | If enabled, the value in the designated control address indicates the number of lines to be scrolled down. The minimal value is 0, which indicates the first line. |
| History Control | ● [Enable reading multiple histories] is not selected The history files are sorted by date and each file is given an index which is expressed as the number of days before today. 0: today, 1: yesterday, and so on. The history control address is used to specify the history file to be displayed. ● [Enable reading multiple histories] is selected Displays a list of events triggered in multiple days. The display range is formed by two consecutive addresses. Please note that the history control address is defined differently in “Number of days” mode and in “Specific days” mode. Number of days Suppose the history control address is set to LW-n, then: [LW-n]: The start day index (which is expressed as the number of days before today. 0: today, 1: yesterday, and so on.) [LW-n+1]: The total number of days to display. The days are calculated backward from the start day. Specific days Suppose the history control address is set to LW-n, then: [LW-n]: The start day index. 0: today, 1: yesterday, and so on. [LW-n+1]: The end day index. The specified value must be greater than that of the start day index. Example: When start = 4 and end = 7, the specified days will be 4 days before to 7 days before. |
For cMT / cMT X Series, all the events that occurred are displayed and updated in real-time.
Press the Option Button in the upper right corner or the object and set the start and end date. If the dates are not set specifically, all the events are displayed.
Event Display Tab
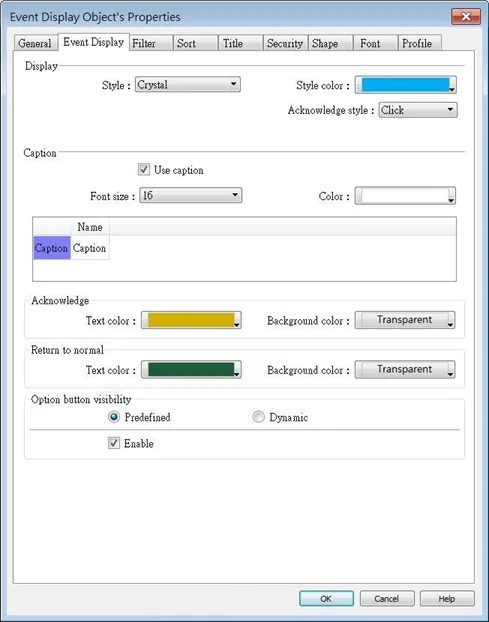
| Setting | Description |
|---|---|
| Include categories | Events in the selected category will be displayed. The categories are set in Event (Alarm) Log object. For example, if the category is set to 2 to 4 here, only events in categories 2, 3, 4 will be displayed. For more information, see “7 Event Log”. |
| Acknowledge style | Select [Click] or [Double Click] to acknowledge each single event. When an event occurs the user can tap the event line once or twice to acknowledge the new event. When acknowledged, the text color of the event will change to the selected color, and the acknowledge value associated with that event will be sent to the register designated in [Acknowledge address]. If the address is set to LW-100, and the acknowledge value is set to 31, when user acknowledges the event, value 31 is written to LW-100. This can be used in conjunction with Indirect Window object so that when an event is acknowledged, the corresponding message window is displayed. |
| Color | Different colors indicate different event states, such as acknowledged, returns to normal, or selected. The system draws a highlight box around the latest selected event. History background (non-cMT Series devices) When using Event Display object and select History mode, the background color of the history record can be customized. |
| Grid | Displays a grid of rows and columns in the object. The color of the grid lines can be selected. Auto fit short column (cMT / cMT X Series Default style) The column width automatically adjusts to the size of the content. |
| Caption | Available styles are: Default, Crystal, and Flat. With [Use caption] enabled, the font size, color, and name of the caption can be specified for Recipe View object. |
| Option button visibility | Show or hide the option button Predefined Select [Enable] to show the option button. Dynamic Designate a bit address to control option button visibility. |
Filter Tab
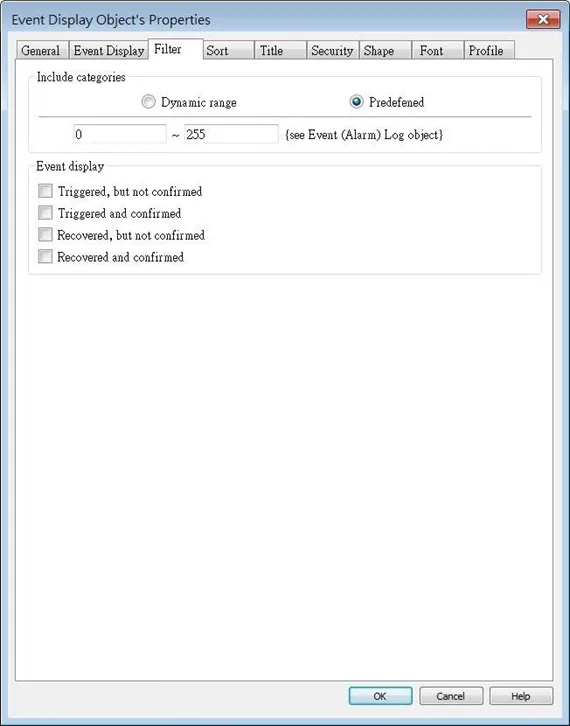
| Setting | Description |
|---|---|
| Include categories | Events in the selected category will be displayed. The categories are set in Event (Alarm) Log object. For example: if the category is set to 2 to 4 here, only events in categories 2, 3, 4 will be displayed. When [Dynamic range] is selected, the object can dynamically filter the displayed event categories based on the value in the specified register. |
Sort Tab
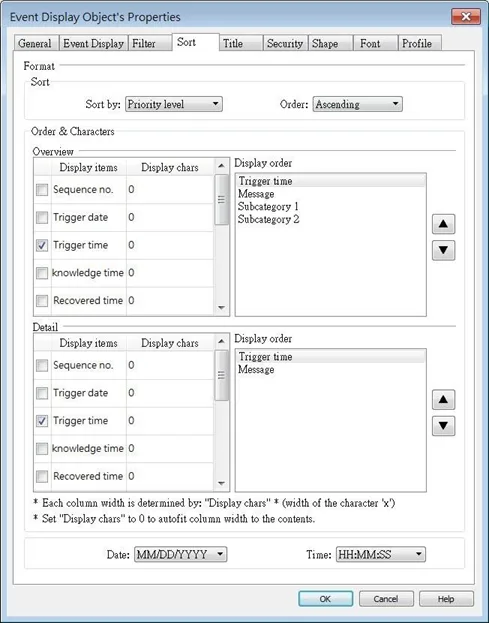
| Setting | Description |
|---|---|
| Order | Sort by: Ascending – Priority Level Events on the Overview page are grouped and sorted by priority level, with the group of events with highest priority level placed last in the list (the bottom). On the Detail page, all events in the group are displayed in a time descending order, with the latest event placed first in the list (the top). Descending – Priority Level Events on the Overview page are grouped and sorted by priority level, with the group of events with highest priority level placed first in the list (the top). On the Detail page, all events in the group are displayed in a time descending order, with the latest event placed first in the list (the top). Ascending – Time Latest event is placed last in the list (the bottom). Descending – Time Latest event is placed first in the list (the top). |
| Display order | Select the items to be displayed and use the up and down arrow buttons to adjust the display order of the events. |
| Date | Displays the date tag with each event message. The four formats of date tag: MM/DD/YY DD/MM/YY DD/MM/YY YY/MM/DD |
| Time | Displays the time tag with each event message. The four formats of time tag: HH:MM:SS HH:MM DD:HH:MM HH |
Title Tab
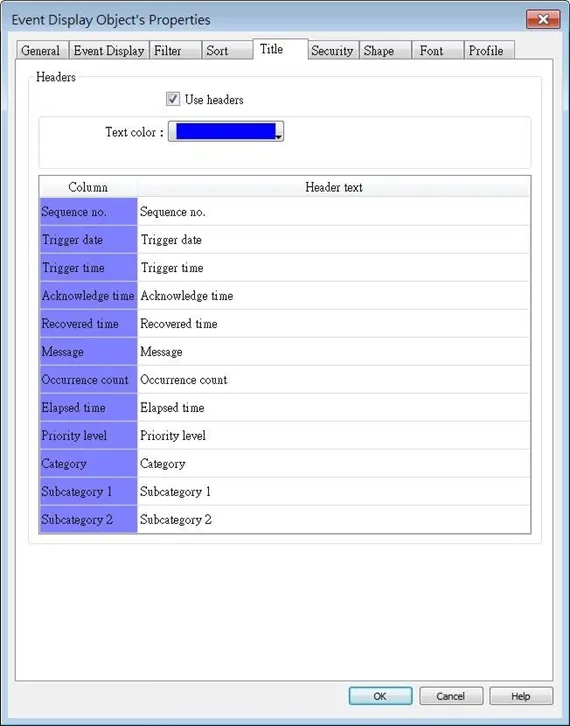
With [Use headers] selected, the text color and column headers can be configured.
Security Tab
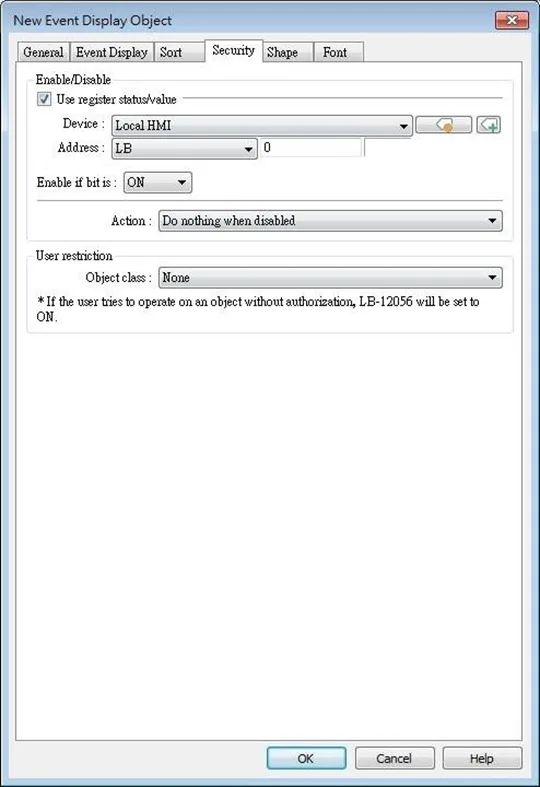
| Setting | Description |
|---|---|
| Interlock | When [Use interlock function] check box is selected, whether the object is operable is determined by the state of a designated Bit address. As shown in the above settings, if LB-0 is ON, the object is operable. Hide when disabled When the designated Bit is OFF, the object will be hidden. |
| User restriction | Set the security class of the object to be operated by an authorized user. Object class “None” means any user can operate this object. Only account “admin” can operate “Administrator” object class. Make invisible while protected When the user’s privilege does not match the object class, the object will be hidden. When this check box is deselected, the unauthorized user can see the Event Display object, but cannot trigger the object or make any change. |
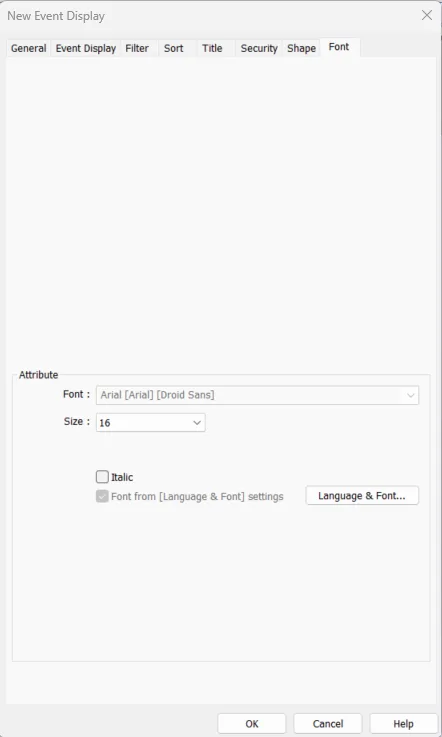
Font Tab
Notes:
- In Real-time mode: Users may select Italic font and set the font size. The font is displayed according to the setting in Event Log object.
- In History mode: Users may select Italic font and set the font size, font and color, or tick the [Font from label library] check box.