
Overview & Concepts
Data Logging and Trending in EasyBuilder Pro allow the HMI to collect, store, and visualize process data over time. By recording register values from PLC devices or Local HMI memory, the system can maintain a historical record of machine or process activity. This information can then be displayed graphically to help operators and engineers observe patterns, monitor performance, and identify changes in operating conditions.
Data logging is implemented through a Data Sampling Object, which periodically records selected register values and stores them within the HMI or on external storage. The logging configuration determines how often values are captured and which registers are included.
Common types of data recorded include:
- Process measurements such as temperature, pressure, or flow
- Machine performance indicators such as motor speed or current
- Production metrics such as cycle counts or totals
Trending objects use the collected data to present information in graphical form. By plotting recorded values against time, trend displays allow users to visualize system behavior and compare multiple variables simultaneously.
Trending capabilities typically allow operators to:
- View real-time process values as they change
- Display previously logged data for historical review
- Compare multiple signals to observe relationships between process variables
Together, data logging and trending provide a structured method for capturing and analyzing operational data directly within the HMI environment.
Implementation: Data Sampling Object
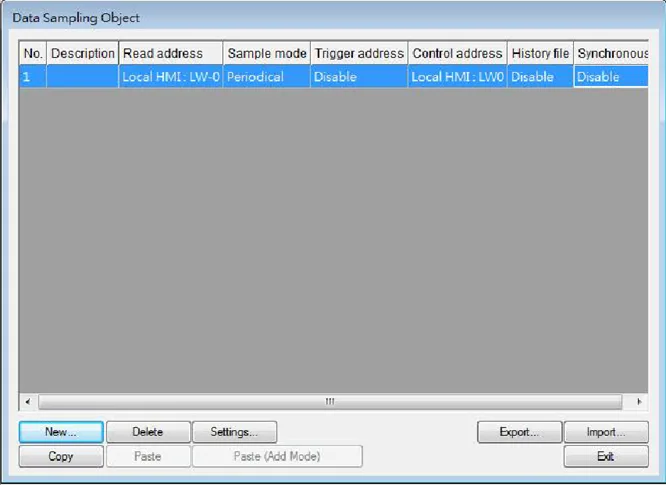
Create a new Data Sampling object first by the following steps:
- From the menu select [Data/History] and click [Data Sampling].
- Click [New] to finish relevant settings.
Time-Based Sampling
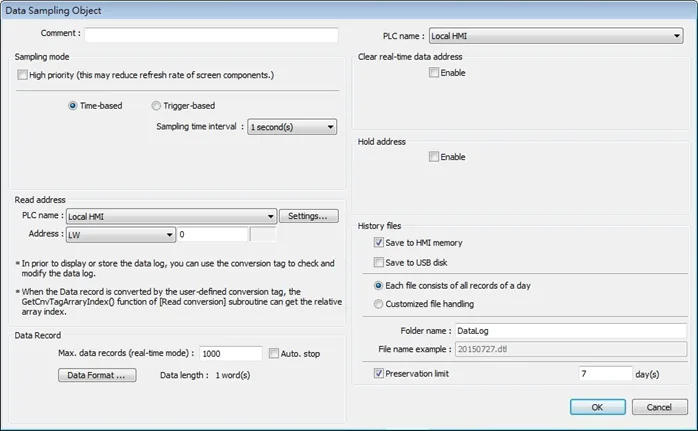
| Setting | Description |
|---|---|
| Sampling mode | High priority Data sampling processes with this feature enabled will be prioritized. Please note that too many priorities can slow down update rate of other objects. Time-based Samples data in a fixed frequency. The [Sampling time interval] can be set from “0.1 second(s) to 120 mins”. Trigger-based Triggers data sampling by the status of a designated bit address. Mode Conditions to trigger Data Sampling: [OFF -> ON] Triggers sampling when the status of the address changes from OFF to ON. [ON -> OFF] Triggers sampling when the status of the address changes from ON to OFF. [OFF <-> ON] Triggers sampling when the status of the address changes. Set ON/OFF after triggered If selected, after triggering Data Sampling, the system will set the designated bit address back to ON/OFF state. |
| Read address | Specify an address to be the source of Data Sampling. To convert a data record, please use a user-defined conversion tag that allows [Read conversion]. For array addresses, the GetCnyTagArrayIndex function can get the relative array index and then calculate. |
| History files | Save to HMI memory Saves Data Sampling to HMI every 10 seconds. Or, use system register [LB-9034] to force storing data. See details on the restrictions of using LB-9034 in the Note below. Save to SD card / USB disk Saves Data Sampling to the specified external device. Each file consists of all records of a day The data sampling file will be saved on a daily basis into the specified folder, and the file name will be yyyymmdd.dtl, indicating the date of the file. Folder name Specify Data Sampling file name which must be all in ASCII characters. The folder name will be written as:[Storage Location] \ [Folder Name] \ [File Name] Preservation limit Determines the number of data sampling files to be preserved. Please note that the current .dtl file is not included in this limit. That is, if this limit is set to 2, apart from the current file, two latest files will be preserved. |
| Customized file handling | This feature can be used to customize naming and management of data sampling files (*.dtl). |
Notes:
- A Data Sampling may include more than one type of records. Data Sampling can retrieve different types of records at the same time. For example, if define three types of data, 4 words in total, the system retrieves a 4-word data each time from the designated address to be the content in one Data Sampling.
- When using [Each file consists of all records of a day] and set [Preservation limit] to 2 files, the data of yesterday and the day before yesterday will be kept. Data that is not built in this period will be deleted to prevent the storage space from running out.
- When using [Customized file handling] and set [Preservation limit] to 2 files, not only the currently sampled file, another 2 newest files (3 files in total) will be kept. The rest of the data will be deleted to prevent the storage space from running out.
- When running simulation on PC, all data sampling will be saved to the datalog folder in C:EBPro[Storage Location]datalog. If you change the data format of data sampling, delete the previous data records in the installation directory to prevent the system from reading the old records.
- When saving files to USB disk or SD card, the capacity of a FAT32 folder depends on the length of the file names. Fewer files can be saved when the file names are longer.
- When using LB-9034, the shortest interval between two successful executions is 2 seconds. That is, after LB-9034 is triggered, it can be effective again 2 seconds later.
Trigger-Based Sampling
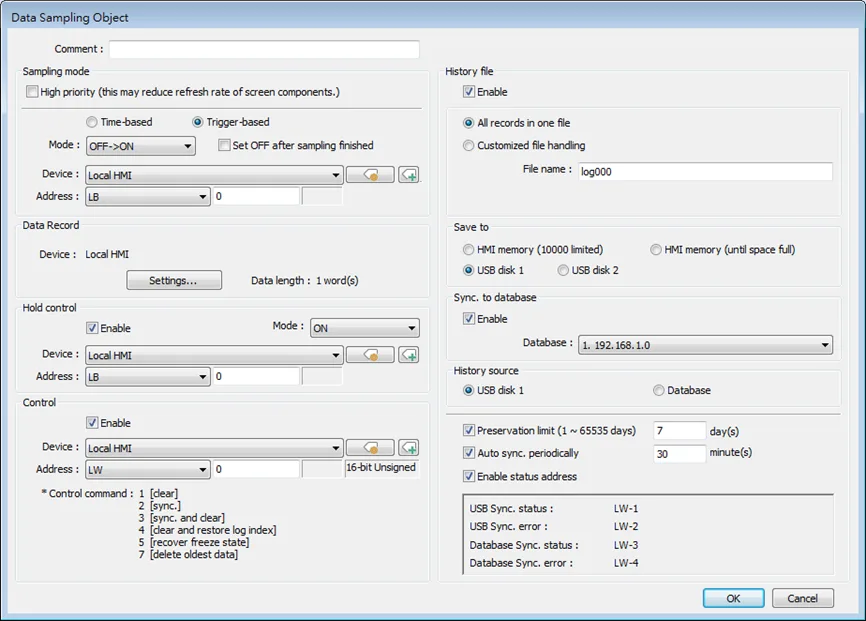
| Setting | Description |
|---|---|
| Data Record | Data of different formats can be sampled. The upper limit for the number of records is 1000. Click the [Settings…] button to set the read addresses of different data types. For selected PLC drivers, sampling addresses of different sections is possible. For the drivers that can only sample contiguous addresses, simply set the data types. The display format settings may be used by Trend Displays and History Data Displays which are set to display the sampled data. Next contiguous address With this option selected when adding a new item, simply set the data type and it will be put into the same section as the previous read address. The following setting aims to read LW-0~LW-17 at a time. |
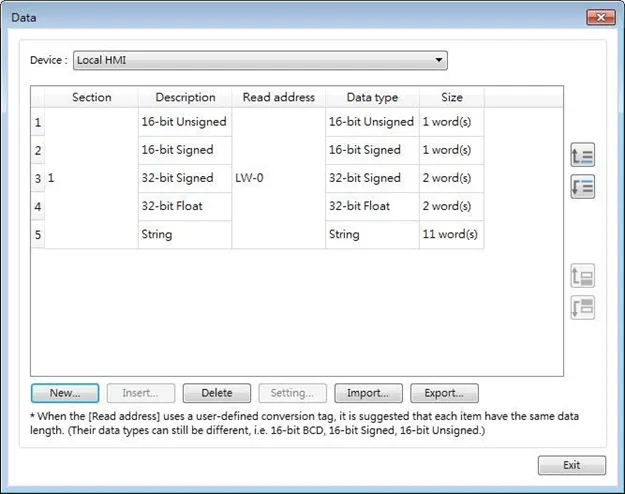
When [Next contiguous address] option is not selected, multiple addresses can be read at a time.
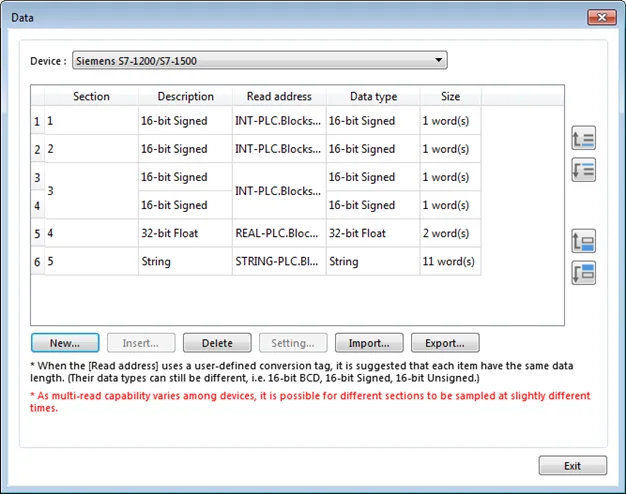
Click [New] and de-select [Next contiguous address] option. The address setting shows, and a different address can be selected.
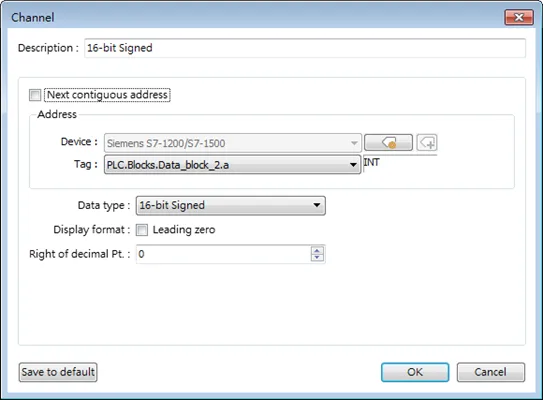
Note:
- When contiguous address setting is used for a tag-based PLC driver, only one-dimensional arrays are supported.
| Setting | Description |
|---|---|
| Control Address | Entering a value in the control address sends the corresponding command: Value 1: Clear the sampled data in HMI Value 2: Synchronize data to the external device / database Value 3: Synchronize data to the external device / database and then clear the sampled data in HMI. Value 4: Use the history data stored in USB disk / SD card / database after changing HMI. Value 5: As data sampling stops when HMI storage is full, this command allows restarting of data sampling when there’s free space. Value 6: Free up memory space reserved for data logs ( *. db). This command can be used when historical data is saved to HMI memory (until space full). Value 7: Delete the oldest data ( *. db). |
| Status & Error address | When LW-n is used as the control address, the four consecutive addresses following LW-n (LW-n+1~LW-n+4) will show status and error, please see the prompt in the settings dialog box. For Status address: LW-n+1 and LW-n+3: Value 0: Disconnected from external device or database Value 1: Connecting with external device or database Value 2: Connected with external device or database Value 3:Storing records into the archive. When this is done, the value returns to 2. For Error address: LW-n+2 and LW-n+4: Value 0: None Value 1: Unknown error Value 2: Failed to connect with external device or database Value 3: Access denied Value 4: Wrong database name Value 5: Inconsistent data format Value 6: Failed to open table Value 7: Failed to create table Value 8: Failed to write table Value 9: Failed to open database Value 10: Database is corrupted Value 11: The Row ID from the external device is inconsistent with the internal Row ID. |
| History Files | History data can be saved to HMI memory (10000 limited or until space full), USB disk, SD card, and Database (by synchronizing history data to database server). The rules of saving the data are: ● When [Save to HMI memory (10000 limited)] is selected and the sampled data reaches 10000 records, the system will delete the earliest 1000 records and keep on saving data to HMI memory. ● When [Save to HMI memory (until space full)] is selected, the system will keep on saving data to HMI memory, in this case, the data may not be synchronized to database server. When the HMI memory storage is full, the system will delete the earliest 1000 records and keep on saving data to HMI memory. ● When USB disk or SD card is selected, and the number of records reaches 10000, the system will automatically save the sampled data to the external device and delete the earliest 1000 records on HMI. ● To synchronize the data to database server, select a database that has been configured before. |
| Customized file handling | This feature can be used to customize naming and management of data sampling files (*.db). The current *db file is saved in HMI memory. Please note the following two points when Sync. Destination is USB disk / SD card: 1. When *db file name changes, the *.db file with the former name will be synchronized to USB disk / SD card. 2. If a new *db file is generated when there’s no existing USB disk / SD card on HMI, the earlier *db file will be deleted. For example, if 20161218.db is the current file, when 20161219.db is generated and no external device is inserted to HMI, and then 20161218.db will be deleted. When [Customized file handling] is used, enabling [Sync. to database] is not possible. |
| Auto sync. periodically | Data will be automatically synchronized to the designated external device in the specified time interval, regardless of the rules explained above. Please note that the timer will reset when a control address is used. |
| All record in one file | When Sync. Destination is USB disk / SD card, the preservation limit is 1 to 65535 days. |
| Customized file handling | When Sync. Destination is USB disk / SD card, the preservation limit is 1 to 65535 files. When Sync. Destination is HMI memory, the preservation limit is 1 to 1000 files. |
| History source | Data can be read from USB disk, SD card, or Database. |
Customized File Handling
This feature can be used to customize the naming and management of the data sampling file logs (*.db, *.dtl file extensions)
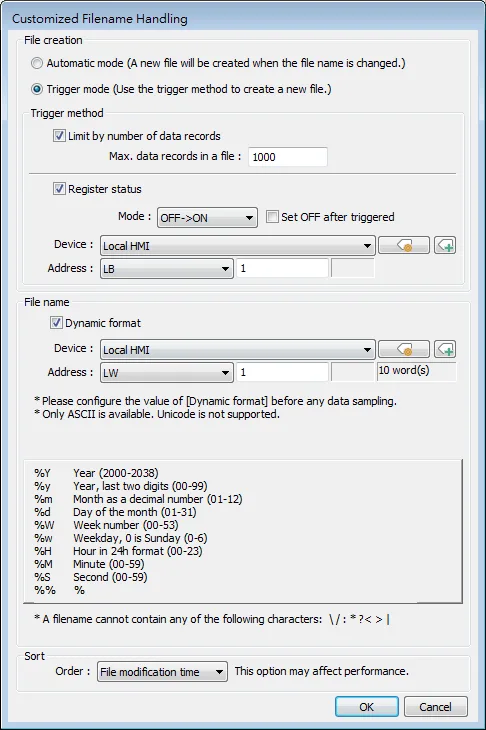
| Setting | Description |
|---|---|
| File creation | Automatic mode A new file will be created when the name of an existing file is changed. Trigger mode A new file will be created according to the [Trigger method] settings. |
| Trigger method | Limit by number of data records A new file will be created when the number of data sampling records reaches the specified “Max. data records in a file” Register status A new file will be created when the status of a designated bit address meets the specified condition. The condition is specified in Mode field. Set ON/OFF after triggered If selected, after the new file is created, the system will set the designated bit address back to ON/OFF state. Following HMI reboot, generate and write to a new file only after trigger condition has been met. When the trigger condition has not been met following HMI reboot and therefore no new file is generated, the new data will be written to the last file generated before HMI is rebooted. Downloading a new project to HMI is the same as rebooting HMI. |
| File name | The file name can be an alphanumeric name, and certain half-width symbols are allowed. The file name can also be specified by a file name syntax. Dynamic format The file names can be set by a designated word address, or by a file name syntax indicating the current system time. The file name syntax can be specified by selecting time buttons or entering the syntax in Format field. The length limit is from 1 to 25.The following half-width characters are not allowed:\ / : * ? ” < > | |
| Sort | This setting affects how the system determines the sort order of historical files, which affects the file preservation and backup logic. File name Files are sorted by their filenames in descending order. File modification time Files are sorted by the actual timestamps of the contents. (Because the system has to check the content of the files, this option may affect performance negatively.) Example: Consider the case where files have been generated in this order: filename_05–> filename_04–> filename_03–> filename_02–> filename_01. The earliest file is filename_05 and the latest file is filename_01. With preservation limit set to 5 files, the two sorting methods yield different results when the 6th file is generated: Sorted by Filename: filename_05 is seen as the latest file; therefore, filename_01 will be deleted. Sorted by File Modification Time: filename_01 is seen as the latest file; therefore, filename_05 will be deleted. Note on naming convention:When File Name is selected as the sorting method and the filenames are: filename_1, filename_2, and filename_10, filename_2 will be seen as the latest file, followed by filename_10 and filename_1. To make filename_10 the latest file, please zero-pad the numbers and name the files to: filename_01, filename_02, and filename_10. |
Notes:
- In Data Record settings, if the option [Next contiguous address] is not selected, the upper limit for the number of sections is 8.
- If both [Limit by number of data records] and [Dynamic format] check boxes are selected, before startup HMI, please enter the name in the designated register for Dynamic Format, otherwise, it is impossible the reach the “Max. data records in a file”, and the data sampling file will not be generated.
- When a new file is generated, the system will first detect if the filename already exists. If the file name does exist, the newly sampled data will be appended to the existing file
Synchronizing cMT Viewer data and Saving to External Device or Database
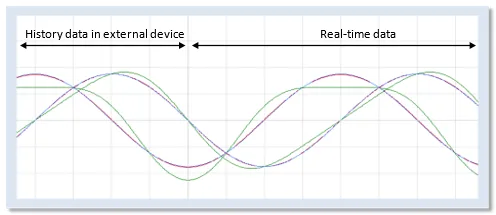
cMT / cMT X Series allows displaying history data and at the same time updates real-time data in one Trend Display or History Data Display object. The data saved in the external device can be updated.
Rules for synchronization the data saved in the external device:
- When the sampled data reaches 10000 records, HMI will automatically save data to the external device and deletes the earliest 1000 records in HMI.
- If the external device is removed from the HMI and inserted back again at the time when the sampled data is under 9000 records, the data generated during the time the external device is removed is saved in HMI and is not cleared. If the data exceeds 9000 records during the time the external device is removed, the earlier data is cleared and cannot be synchronized even to insert the external device back to the HMI.
- If there already exists sampled data in the external device, the new data is appended without overwriting the original data each time in synchronization.
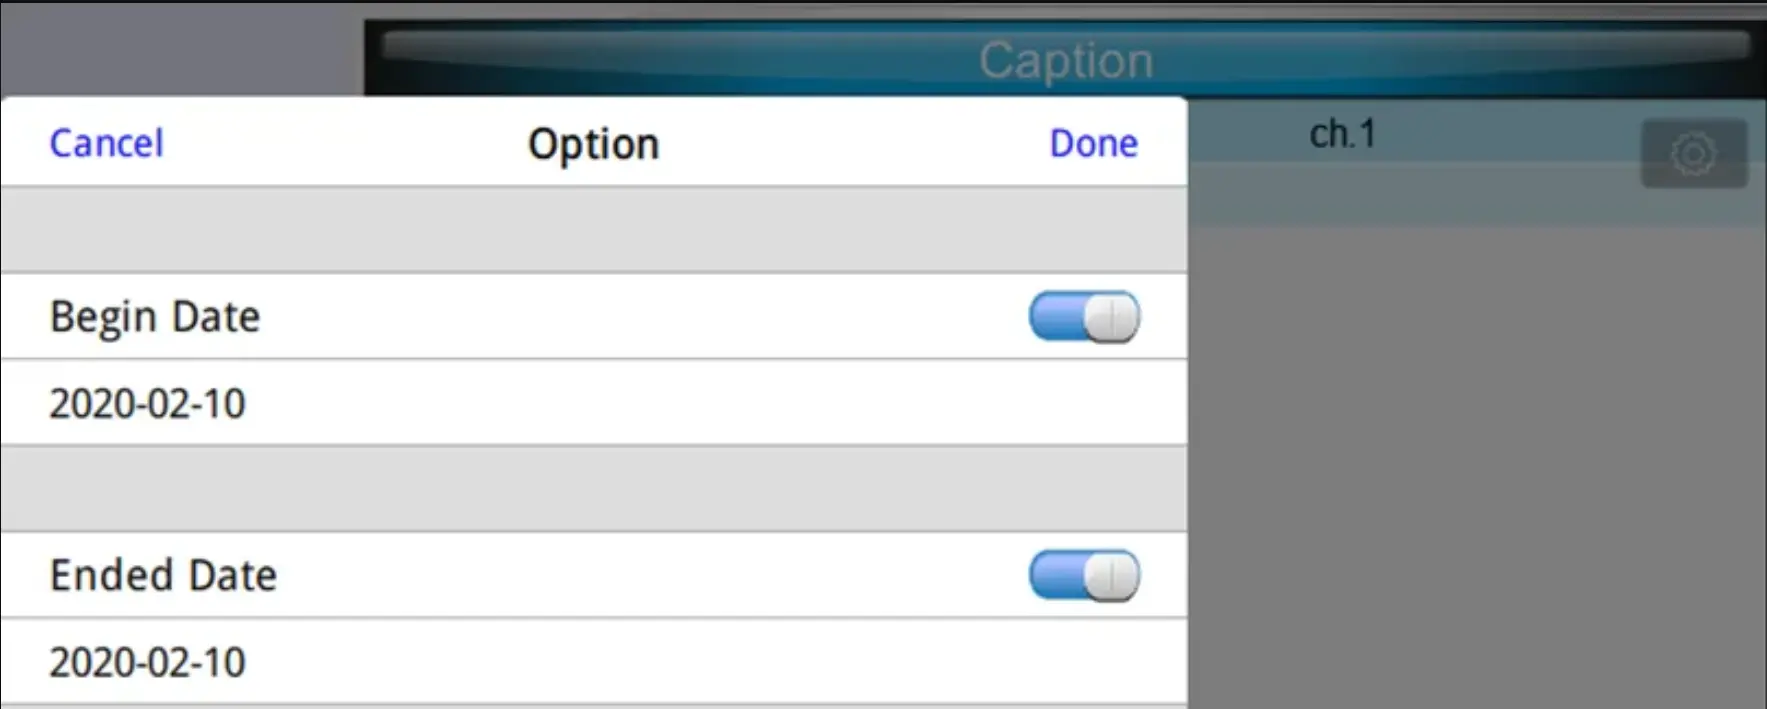
Checking History Data of a specific Date/Time on cMT Viewer
How to check the history data of a specific data and time using cMT Viewer
Instructions: Checking History Data of a specific Date/Time on cMT Viewer
Tap the Settings icon
Tap the Settings icon in the upper-right corner of the Trend Display Object
The Options Dialog opens
The Trend Display Dialog box opens, allowing you to choose settings such as begin/end date, Y-axis scaling, and which file to view (depending on the specifics of your trend display)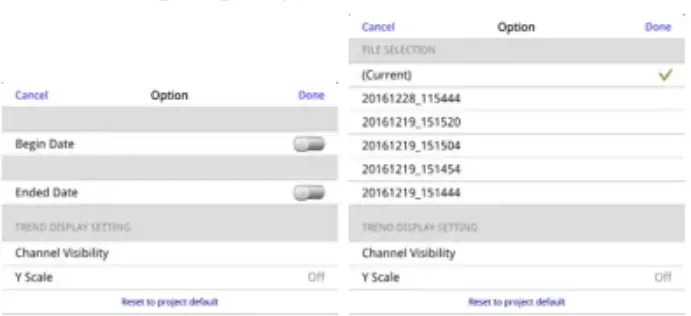
Specify Date or File
You can specify dates to view, or individual files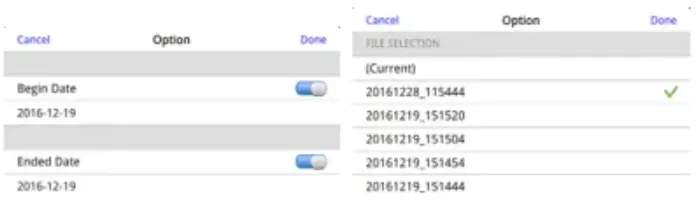
Done
Tap the Done button to finish the setting.

Implementation: Trend Display
Trend Display Objects are the visual representations of the data recorded by the underlying Data Sampling Object.
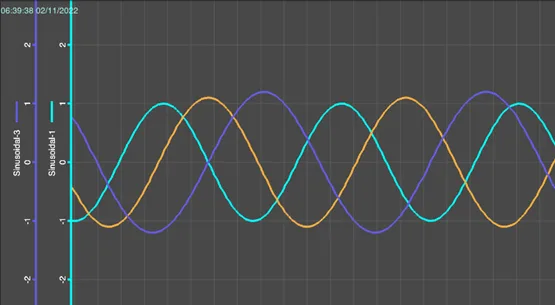
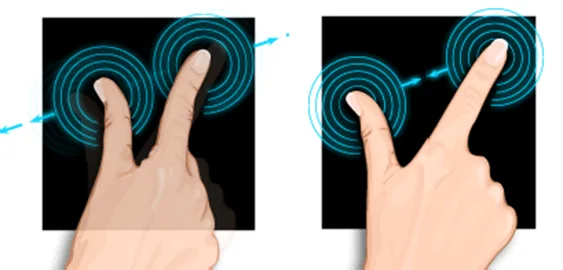
The Trend Display on cMT / cMT X Series combines Real-time mode and History mode. Drag left to scroll the Trend Display to view history data and drag right to view the latest sampling data. Pinch two fingers together to zoom out Trend Display or spread them apart to zoom in.
Click [Data/History] » [Trend Display] icon on the toolbar to open a Trend Display object property dialog box. Set up the properties, press OK button, and a new Trend Display object will be created.
General Tab
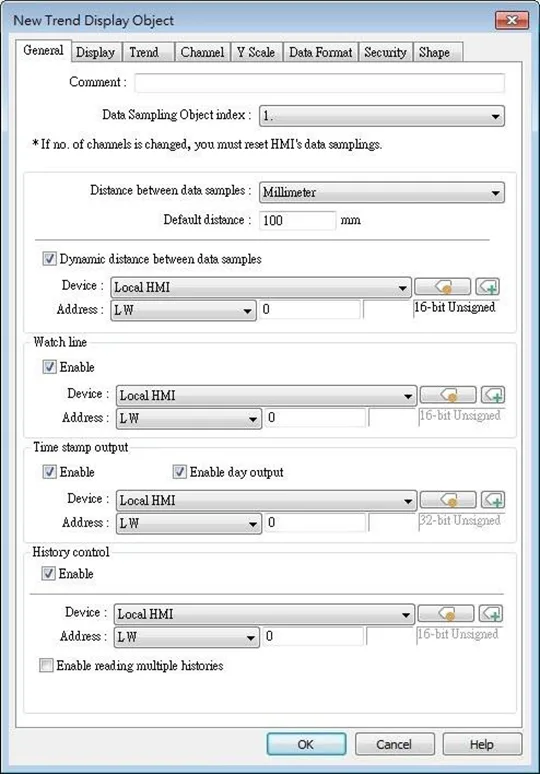
| Setting | Description |
|---|---|
| Data Sampling Object index | Select a Data Sampling object as the source data. |
| Refresh data automatically | In history mode, when this option is selected, Trend Display will be automatically refreshed every 10 seconds. If this option is not selected, Trend Display can only be refreshed by changing window. |
| No line connection between records if the next record is earlier | When HMI time is adjusted to an earlier time, and data sampling keeps going on, selecting this option can prevent the system from drawing a line to connect the gap between current trend curve (earlier in time axis) and former trend curve (later in time axis). This can slow down refresh speed. |
| Trend type | Select the mode of data source, either [Real-time] or [History]. Real-time In this mode, the display object shows all sampled data since the HMI started. The maximum number of records that can be sampled is set in [Max.data records] (Real-time mode) of the Data Sampling object. When the sampling data exceeds this setting, the earlier data will be deleted. To show older data, use [History] mode.[Hold control]: Suspends the update of Trend Display. However, it does not stop the sampling process of Data Sampling object. History In this mode, the data comes from the history data files stored on HMI. The history data files are sorted by dates, and each is given an index. The system uses [History control] to select the history data files that are created on different dates. The system sorts the history data of sampling data by date; the latest file is record 0 (typically the data sampled today), the second latest file is record 1, and so on. If the value of designated register in [History control] is n, the Trend Display object will display data record n. Here is an example to explain [History control]. If the designated register is LW-0, and the sampling data files available are pressure_20061120.dtl, pressure_20061123.dtl, pressure_20061127.dtl, and pressure_20061203.dtl, and it is 2006/12/3 today, based on the value of LW-0, the sampling data file which will be selected by [Trend Display] is shown as follows: Value of LW-0 is 0: pressure_20061203.dtl is selected Value of LW-0 is 1: pressure_20061127.dtl is selected Value of LW-0 is 2: pressure_20061123.dtl is selected Value of LW-0 is 3: pressure_20061120.dtl is selected. If use with Option List object and select data source as [Dates of historical data], the history data will be sorted by date and displayed in Option List object, |
| Pixel | [Distance] is used to set the distance between two sampling points. |
| Time | [Distance] is used to set the X-axis in unit of time. Select [Time] for [X axis time range] and go to [Trend] » [Grid] and enable [Time scale]. |
| Dynamic distance between data samples / Dynamic X-axis time range | Designate a 32-bit word register for adjusting the distance between two sampling points (select Pixel), or the time unit represented by X-axis (select Time). If no value is entered, the default value will be used. |
| Refresh data automatically | If selected, every time when opening the window on which the Trend Display object in history mode is placed, the display is automatically refreshed every 10 seconds. Please note that: ● The refresh status can be observed from the control button of Trend Display object. Showing pause button: The automatic refresh feature is enabled. Showing play button: The automatic refresh feature is disabled. ● When scrolling to the previous data, the automatic refresh feature is disabled, the play button is shown. ● If [Refresh data automatically] check box is selected, when change back to the window, the display is refreshed, ignoring the control buttons. For example, select [Refresh data automatically], and scroll to the previous data, the automatic refresh feature is disabled. In this case, changing to another window and then change back will still refresh the display. ● If [Refresh data automatically] check box is not selected when building the project, the feature can still be enabled by pressing play button on HMI. In this case, the automatic refresh feature is disabled, that is, even when change back to the current window, the display will not be refreshed. |
| Hold control | When the register is set ON, suspend the update of Trend Display. It does not stop the sampling process of Data Sampling object. This setting is available only in Real-time mode. |
| Watch line | Use the [Watch line] function to display a “watch line” when user touches the Trend Display object. It will also export the sampling data at the position of watch line to the designated word device and use Numeric objects to display the results [Watch line] can also export sampling data with multiple channels. The system will consecutively write each channel to the specified address and the following addresses, in the same order as in [Data Sampling] object. The address assigned to [Watch line] is the start address, and sampling data for each channel will be exported to the word devices starting from “start address.” If the data format of each channel is different, the corresponding address of each channel is arranged from the first to the last. |
| Time stamp output | When enabled, the number of seconds passed from the first sampling data can be calculated. Suppose the address is set to LW-n, then: [LW-n]: The number of seconds passed from the first sampling data to the closest sampled point. [LW-n+2]: The number of seconds passed from the first sampling data to the most recent sampling data. Enable day output With this option selected, the number of days passed since 1970/1/1 can be calculated. Suppose the address is set to LW-n, then: [LW-n+4]: The number of days passed since 1970/1/1 to the closest sampled point.[LW-n+6]: The number of days passed since 1970/1/1 to the most recent sampling data. |
| History Control | Enable reading multiple histories: In the following two modes, days are calculated backward. Number of days Suppose the address is set to LW-n, then: [LW-n]: The start day index from which to calculate number of days.0: today, 1: yesterday, and so on. [LW-n+2]: The total number of days before the start day. Specific days Suppose the address is set to LW-n, then: [LW-n]: The start day index from which to calculate number of days.0: today, 1: yesterday, and so on. [LW-n+2]: The end day index, the specified value must be greater than that of the start day index. For example, if start is 4 and end is 7, the specified days will be 4 days before to 7 days before. |
Display Tab
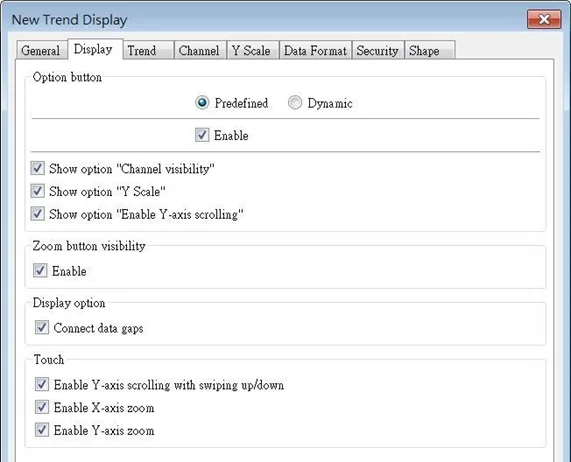
| Setting | Description |
|---|---|
| Option button visibility (cMT Series) | Show or hide the option button of the object. Predefined Select [Enable] to show the option button. Dynamic Choose a bit address to control option button visibility. Show option “Channel visibility” With this option selected, the [Channel Visibility] setting will be displayed. Show option “Y Scale” With this option selected, the [Y Scale] setting will be displayed. Show option “Enable Y-axis scrolling” With this option selected, the [Enable Y-axis scrolling] setting will be displayed. |
| Zoom button visibility | Show or hide the zoom button of the object. |
| Display option | Show custom file name This option appears when [Customized file handling] is selected in Data Sampling. With this option selected, the customized file name is shown as caption in Trend Display. Connect data gaps Data sampling stops when PLC is disconnected, and after PLC is reconnected, the trend curve of the disconnected period is plotted with a gap. With this option selected, the system will draw a line to connect the gap between the former trend curve (before disconnected period) and the current trend curve (after disconnected period). |
| Touch | Disable Y-axis scrolling with swiping up/down With this option selected, dragging the object with your finger will only scroll X-axis range while Y-axis remains being placed in the middle of the object even if it is zoomed in/out. Disable X axis zoom With this option selected, dragging the object with your finger will only scroll Y-axis range. Disable Y axis zoom With this option selected, dragging the object with your finger will only scroll X-axis range. |
Trend Tab
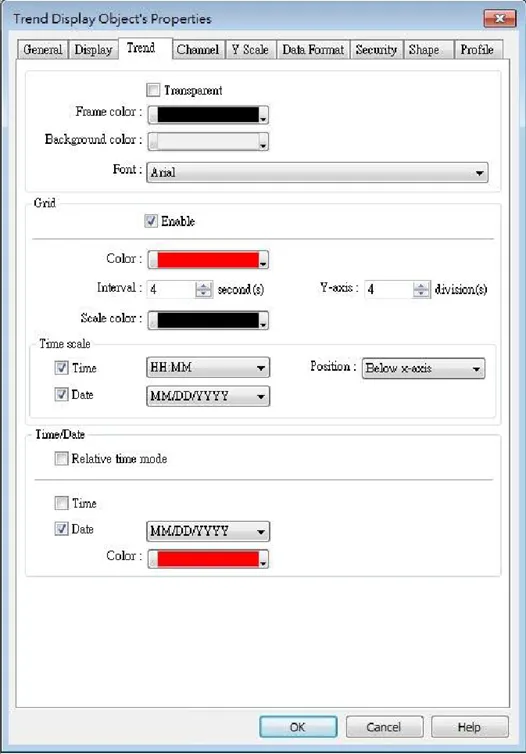
| Setting | Description |
|---|---|
| Transparent / Frame / Background | Select the color of frame and background. |
| Grid | Set the number of dividing lines and the line color. The number of divisions depends on the setting in General tab » [Distance between data samples] / [X axis time range]. X-axis interval The number of vertical grid lines. ● Select [Distance between data samples] in General tab: Select how many sampling points will be included between two vertical grid lines. ● Select [X axis time range] in General tab: Select the time range between two vertical grid lines. X-axis division The number of vertical grid lines. Y-axis division The number of horizontal grid lines. |
| Time scale | Select [Time] / [Date] check box to display the time scale along the x axis. The position of the time scale can be selected.The default font size is 8. |
| Time / Date | Relative time mode When this mode is selected, the time of the earliest sampling data will be the start time from which to count a relative time. This mode works with time scale [SSSSSS] and under this mode, time scale [Date] cannot be used. The time of latest sampling data will be marked on the top left corner of the object. This group box is used to set the time / date display format and font color. |
Channel Tab
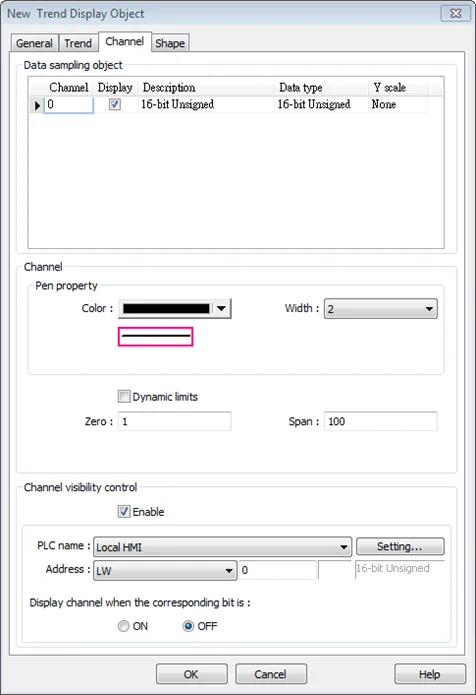
| Setting | Description |
|---|---|
| Y scale | Set Y-axis to be Main Axis or Aux. Axis. See “Y Scale Tab” for more information. At most 32 Y axes can be displayed, including one main axis and multiple aux. axes. |
| Channel | Configure each sampling line’s format and color. Dynamic limits ● Not selected: [Zero] and [Span] are used to set the low limit and high limit of sampling data. If the low limit is 50 and the high limit is 100 for one sampling line, [Zero] and [Span] must be set as [50] and [100], so that all the sampling data can be displayed in the trend display object. ● Selected: The low limit and the high limit are read from the designated word devices. |
| Channel visibility control | If [Enable] is selected, the bits of the assigned word register will be used to show/hide each channel. The first bit controls the first channel, and the second bit controls the second channel, and so on. Note on using this feature: Each control bits are not reserved for the channel. If a particular channel is not displayed, the control bit is assigned to the next displayed channel. For example, if the third channel of the 5 channels is not displayed, only 4 channels will be displayed in Trend Display, and the used control bits will only be: LW_bit-000~003. |
Notes:
- A Trend Display can display up to 64 channels simultaneously.
- A Trend Display can only display channels with serial number ≤ 256; therefore, channels with serial number greater than 256 cannot be selected.
Y Scale Tab
The scale along the Y axis of a specific channel can be displayed. To enable Y Scale, [Grid] should first be enabled in [Trend] tab.
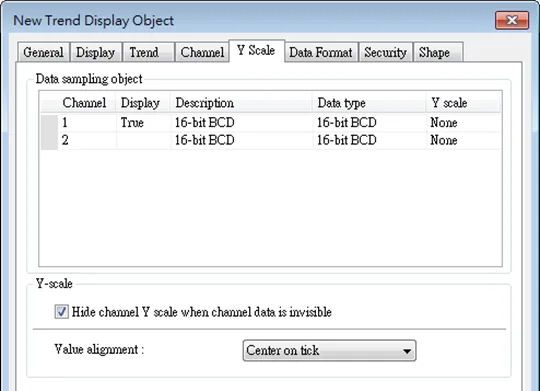
| Setting | Description |
|---|---|
| Y Scale | Hide channel Y scale when channel data is invisible This option is selected by default. With this option selected, whether channel Y scale is shown or hidden is determined by the settings in Channel Visibility Control. Value alignment Set the alignment of Y axis tick values. Y Scale can be configured on the in cMT Viewer as shown in the following steps. 1. Tap the [Insert image here] button on the upper right corner of Trend Display object. 2. Tap [Trend Display Setting] » [Y Scale]. 3. Set channel visibility. |
Data Format Tab
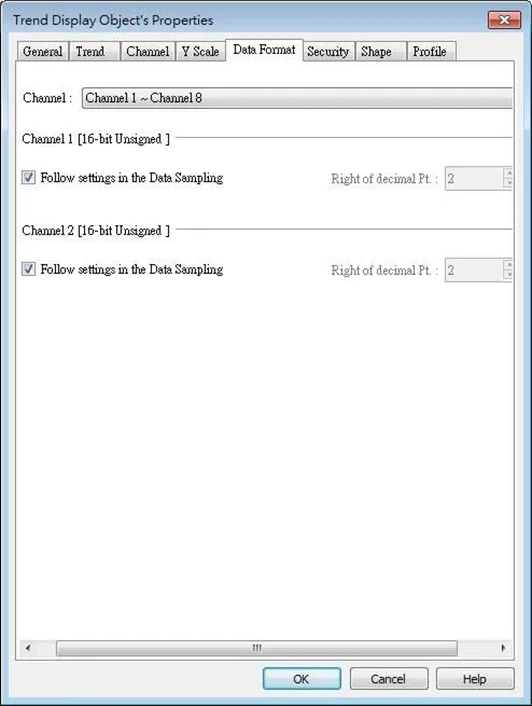
| Setting | Description |
|---|---|
| Follow settings in the Data Sampling | Use the [Right of decimal Pt.] setting in Data Sampling. |
| Right of decimal Pt | The number in this field determines the number of decimal places of the value displayed; for example, when 1 is entered in this field, and the original value obtained by Data Sampling is 45, then 4.5 will be displayed in Trend Display as a result. |

Implementation: History Data Display
History Data Displays differ from Trend Displays in that the History Data Display object uses a table structure to visualize the data instead of the trend graph.
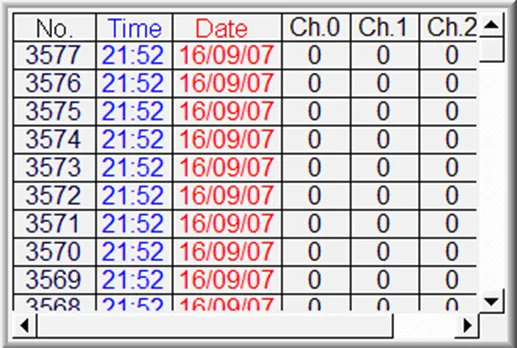
General Tab
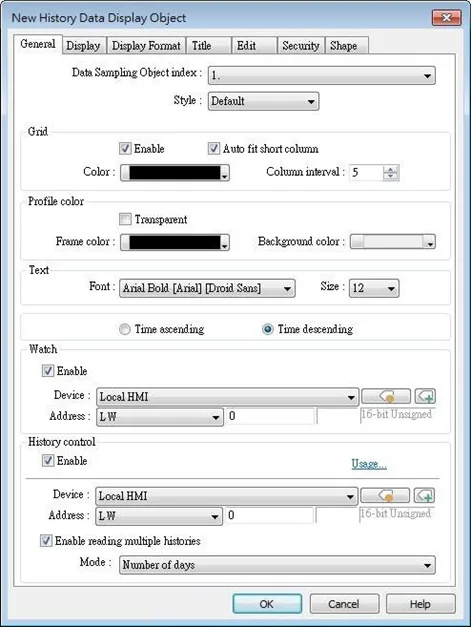
| Setting | Description |
|---|---|
| Data Sampling object index | Select a Data Sampling object as the source data. |
| Refresh Data Automatically | The system will refresh data every 10 seconds. When this option is not selected, data can be refreshed only by changing windows. |
| Style | Select History Data Display object’s style. |
| Grid | Shows grids between rows and columns. Color Change the color of grids. Column interval Change the width of each column. |
| Profile color | Change the color of frame and background. Use [Transparent] to hide frames and background. |
| Text | Change the font and font size. |
| Time / Date | Time ascending Put earliest data at the top and the latest data at the bottom. Time descending Put the latest data at the top and the earliest data at the bottom. |
| Watch | By tapping on a record in History Data Display object, data in the selected row can be output to the designated addresses. |
| History Control | Enable reading multiple histories: In the following two modes, days are calculated backward. Number of days Suppose the address is set to LW-n, then:[LW-n]: The start day index from which to calculate number of days.0: today, 1: yesterday, and so on.[LW-n+2]: The total number of days before the start day. Specific days Suppose the address is set to LW-n, then:[LW-n]: The start day index from which to calculate number of days.0: today, 1: yesterday, and so on.[LW-n+2]: The end day index, the specified value must be greater than that of the start day index. e.g. start: 4, end: 7, the specified days will be 4 days before to 7 days before. |
Note:
- When using cMT / cMT X Series, use the gear icon in the upper-right corner of History Data Display object in cMT Viewer to select the date and display the data.
Display Tab
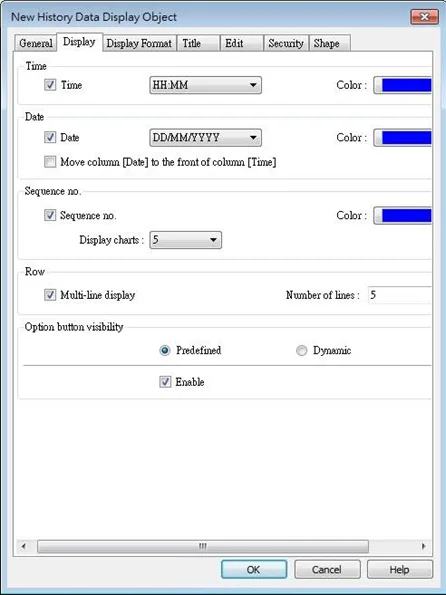
| Setting | Description |
|---|---|
| Time / Date | Enable or disable showing the time and date and configure its format and color. Move column [Date] to the front of column [Time] Swap the position of column [Date] and column [Time]. |
| Sequence no. | Show the sequence number of all records. |
| Row | Multi-line display Display a specified number of lines of data. Data will be displayed as specified regardless of the actual number of lines of data. |
| Option button visibility (cMT / cMT X Series) | Show or hide the option button. Predefined Select [Enable] to show the option button. Dynamic Designate a bit address to control option button visibility. |
Data Format Tab
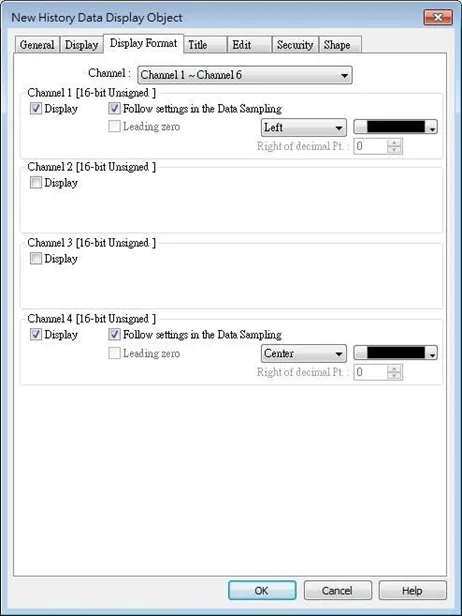
| Setting | Description |
|---|---|
| Channel | Each History Data Display object can display up to 64 channels. Check [Display] to select the channels to be shown on the screen. In the figure above, there are 4 channels (channel 1 to channel 4) in the Data Sampling object, and only Ch.1 and Ch.4 are selected. The data formats are shown next to channel name. The data format of each channel is decided by the corresponding Data Sampling objects. Two display modes are available when displaying [String] format in History Data Display object: ● Follow settings in the Data Sampling. ● Reverse high byte and low byte data and then display. |
Title Tab
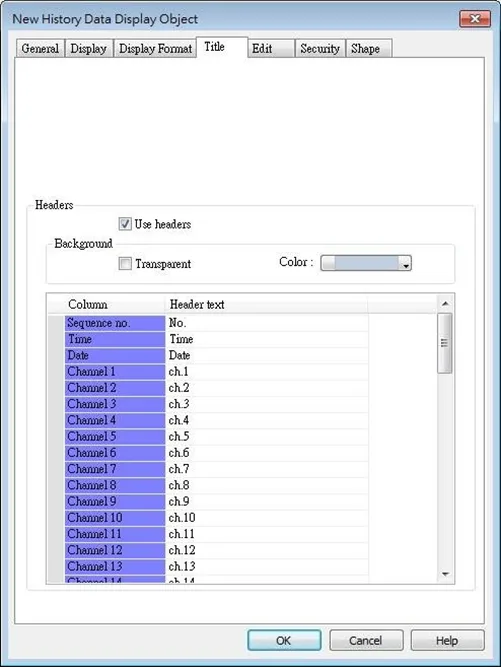
| Setting | Description |
|---|---|
| Use headers | Enable or disable title of each column of data, if desired. |
| Background | Transparent When selected, hide the background for title area. Color Set the background color of title. |
| Setting | Defines the text to be shown on the title. The text can be edited in Label Tag Library. Build the Label Tag Library first, and in History Data Display settings dialog select the checkbox in the Label Library column, and then select the label tag. |
Note:
- When running simulation mode on the PC and wanting to run simulation mode again using the same project, delete the old data sampling records located in the [HMI_Memory, SD_Card or usb1] folder in your EasyBuilder Pro installation file path. This will prevent the system from reading old data in the newest instance of simulation mode.
Edit Tab
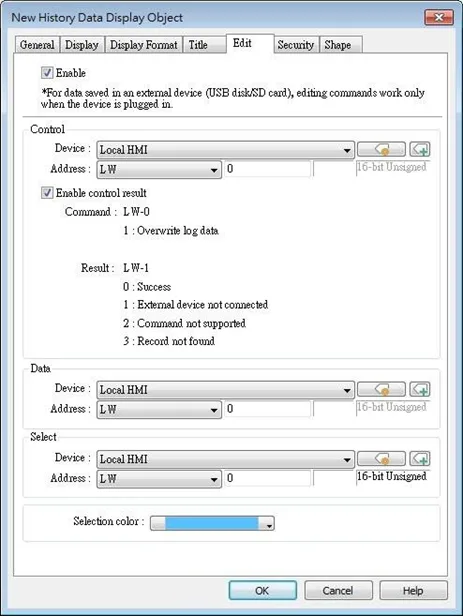
| Setting | Description |
|---|---|
| Control address | LW-n: Command 1: The data in Data Address will overwrite the data in data log. 2: The selected data log will be deleted. LW-n+1: Result (cMT / cMT X Series) 0: The command is executed successfully. 1: The external device is not connected. 2: The command is not supported. 3: The record cannot be found. |
| Data address | The system will start reading row by row from the selected one in History Data Display, and change the data log accordingly. Please note that the settings in this address must be identical to that in Data Sampling. |
| Select address | By changing the value in Select Address, the corresponding row in History Data Display can be selected. Please note that: 1. When the value in Select Address is 0, no row will be selected, and the value in Data Address will stay the same as that of the previously selected row number. 2. When the value in Select Address exceeds the total number of rows in History Data Display, the last row (the one with largest row number) will be selected. |
Note:
- When an external device is used to save data log, removing the external device will make the Edit function ineffective. Editing can continue when the external device is inserted again and the system starts reading historical data.