
Overview & Concepts
The Circular Trend Display in EBPro presents historical data in a circular format, making it easier to visualize values that repeat over a cycle. Instead of plotting data from left to right like a traditional trend graph, the Circular Trend Display wraps the data around a circle, helping operators quickly spot patterns, peaks, and changes that occur at regular intervals.
This type of display works well for applications where process behavior repeats over time, such as daily production schedules, energy usage, temperature cycles, or machine operating sequences. By viewing the data as a continuous loop, recurring trends and anomalies can often be identified more easily than on a standard trend chart.
Common uses for the Circular Trend Display include:
- Monitoring energy consumption over a 24-hour period
- Tracking temperature or environmental conditions throughout a production cycle
- Comparing machine performance during recurring operating sequences
- Identifying patterns that repeat on a daily, weekly, or batch basis
When used with EBPro’s Data Sampling features, the Circular Trend Display provides another way to analyze historical data and gain insight into process performance, especially when the data naturally follows a repeating cycle.

Implementation
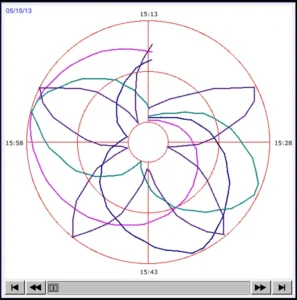
Circular Trend Display object draws the trend curve of Data Sampling in a polar coordinate system, where y-axis represents the radial coordinate and the x-axis represents the angular coordinate. The way to use this object is similar to using Trend Display object.
Click the Circular Trend Display icon on the toolbar to open the property dialog box. Set up the properties, press OK button, and a new Circular Trend Display object will be created.
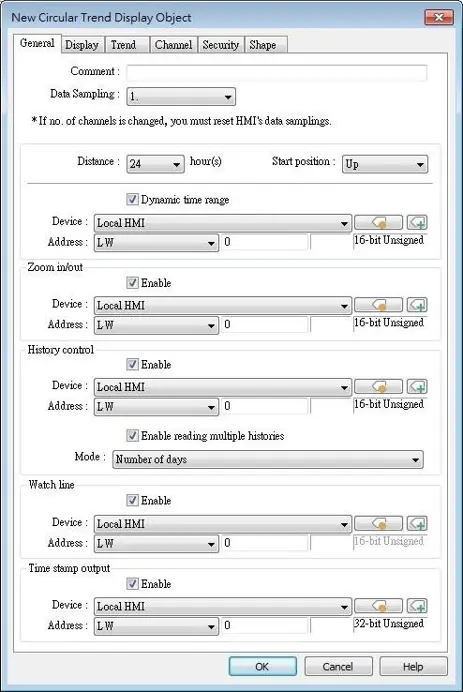
General Tab
| Setting | Description |
|---|---|
| Data Sampling | Selects the data source for drawing the trend curve. |
| Refresh data automatically | If enabled, the window in which the Circular Trend Display object (in history mode) is placed will be refreshed once per second. The scroll controls can be used to check the refresh status. If ⏸ button is displayed, the Circular Trend Display will be automatically refreshed. If ▶ button is displayed, the Circular Trend Display will stop being refreshed. ● Scrolling backward and viewing earlier data will disable [Refresh data automatically]. The button displayed is ▶ at this moment. ● If [Refresh data automatically] is selected, the display is refreshed when change back to this window, regardless of the use of scroll controls. Example: If [Refresh data automatically] is selected, scrolling to the earlier display stops auto-refresh. At this moment change to another window and then change back, the Circular Trend Display is still refreshed. If [Refresh data automatically] is not enabled when building the project, to enable it directly on HMI, simply press ▶. Please note that auto-refresh remains disabled after window change |
| Distance | Defines the time span represented by the circle. The unit is hours, with a range of 1 to 24 hours. |
| Start position | Specifies where the trend curve begins on the circle. Available starting positions are Up, Right, Down, and Left.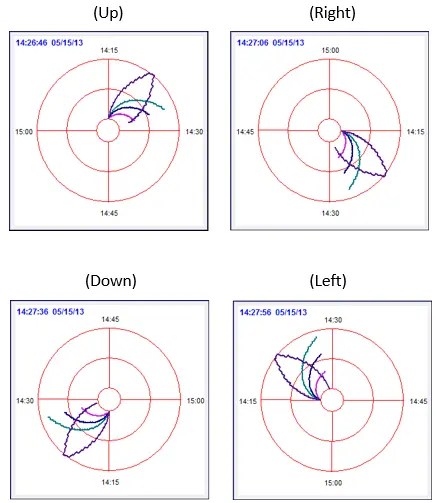 |
| Dynamic X-axis time range | If selected, a word register can be designated to control the time length of Circular Trend Display. The unit is hour. If no value is entered, the distance is set to default. |
| Zoom in / out | Enlarges or reduces the size of the display. The maximum size is 10 times larger than the original. A value of 0 keeps the display at its original size. |
| Hold control | When the register is set ON, suspend the update of Circular Trend Display. It does not stop the sampling process of Data Sampling object. This setting is available only in Real-time mode. |
| History control (cMT, cMT X Series) | Supports viewing multiple days of historical data. Enable reading multiple histories Days are calculated backward from a specified starting day. Number of days [LW-n] specifies the starting day index (0 = today, 1 = yesterday, etc.). [LW-n+2] specifies the number of days to include before the start day. Specific days [LW-n] specifies the starting day index. [LW-n+2] specifies the ending day index, which must be greater than the starting day index. For example, a start value of 4 and end value of 7 displays data from 4 to 7 days ago. |
| Watch line | Displays a watch line when user touches the Circular Trend Display object, and the sampling data at the position of the watch line is output to the designated register. To display sampling data with multiple channels, the system consecutively writes the data of each channel to the designated word register and the following registers. If the data format of each channel is different, the channels are sorted by the data format of its corresponding register. |
| Time stamp output | If selected, the system will start counting time from the first data sampled, and output the elapsed time counted of the latest data sampled to the register designated in [Time stamp output + 2]. When pressing a point on the trend curve, the relative time of the nearest data sample is then output to [Time stamp output address]. Note: The format of the register designated in [Time stamp output] and [Time stamp output + 2] must be 32-bit. [Time stamp output + 2] is only available for Real-time modevwhile [Time stamp output] is available for Real time mode and History mode. |
Display Tab
| Setting | Description |
|---|---|
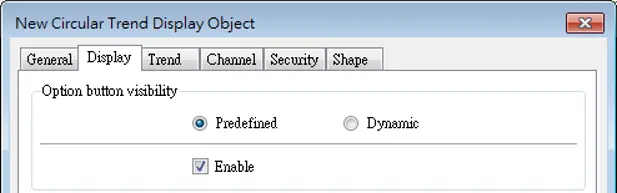
| Option button visibility | Show or hide the option button:  Predefined Select [Enable] to show the option button. Dynamic 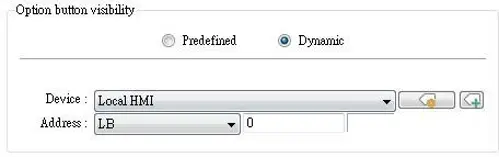 Designate a bit address to control option button visibility. |
Trend Tab
| Setting | Description |
|---|---|
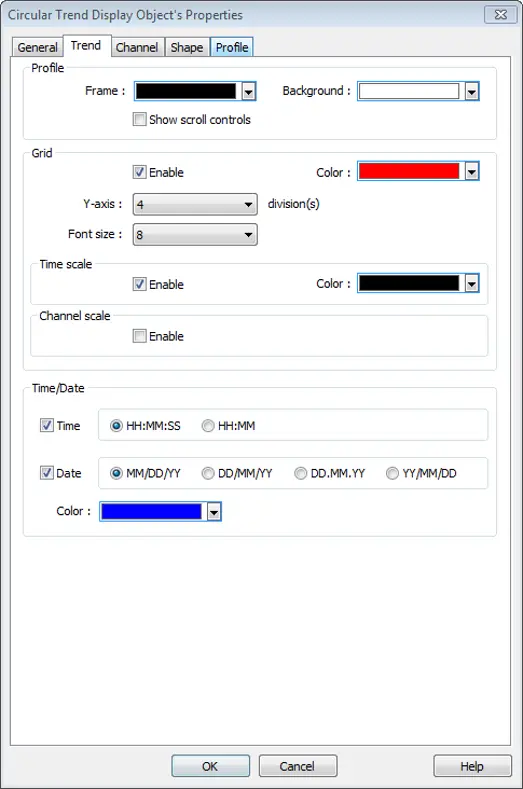
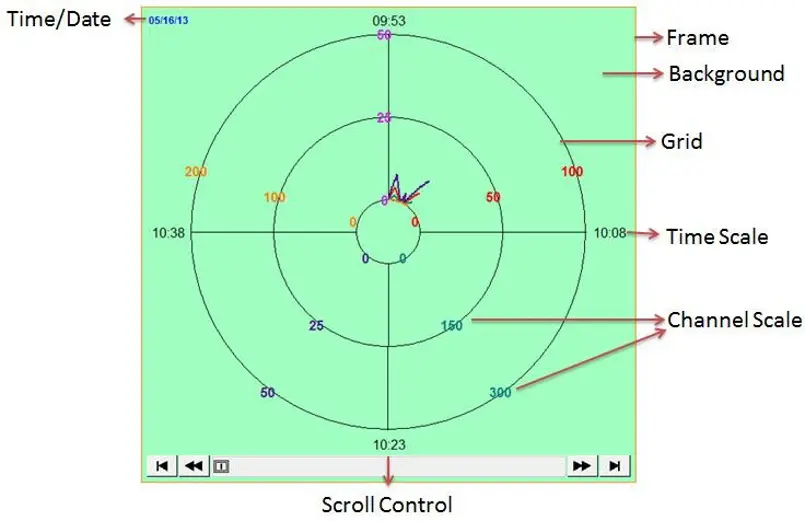
| Profile | Frame Sets the color of the frame of the object. Background Sets the color of the background of the object. Show scroll controls The scroll controls are displayed for scrolling to view the sampling data of other time range. The minimum scrolling unit is determined by the setting of [Distance] in General tab. If [Show scroll controls] check box is not selected, the earlier data cannot be viewed when exceeding the specified [Distance]. For example: Set [Distance] to 1 (hour), then sampling data earlier than one hour is not displayed. |
| Grid | Sets the number and the color of the dividing lines. Y-axis Sets the number of divisions on Y axis. Font size Sets the size of the font which labels the time scale or channel scale. Time scale If enabled, displays the time scale. When the time length is longer than 1 hour, the scale division is 1 hour. When the time length is set to 1 hour, the scale division is 15 minutes. Channel scale If enabled, displays the channel scale. The color of the font which labels the channel scale corresponds to the setting of the trend curve of each channel. |
| Time / Date | Time Sets the display format of time. DateS ets the display format of date. |
Channel Tab
| Setting | Description |
|---|---|
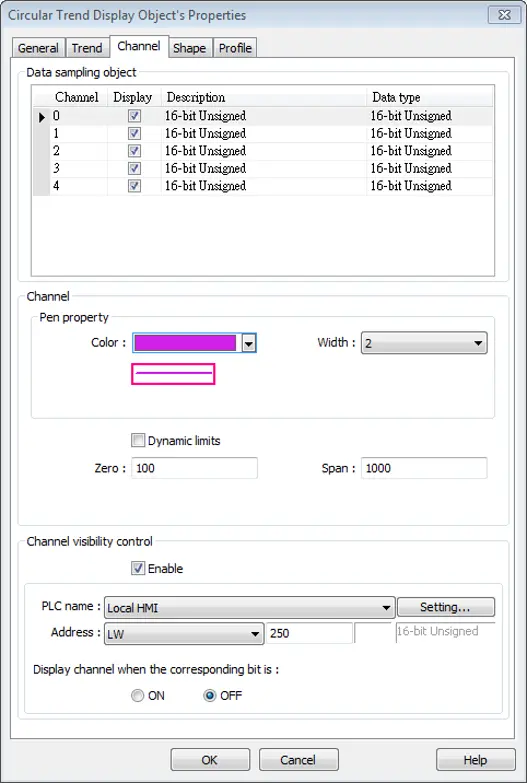
| Channel | Sets the style and the color of the trend curve, and the upper and lower limit of data that can be drawn on the trend curve. Up to 8 channels are supported simultaneously. Not selecting [Dynamic limits] The upper and lower limits of the data are set by constants. Selecting [Dynamic limits] The upper and lower limits are set by the designated register. When the address is LW-n, the corresponding addresses are as the following list: Data format : 16-bit : 32-bit Lower limit : LW-n : LW-n Upper limit : LW-n+1 : LW-n+2 |
| Channel Visibility Control | If [Enable] is selected, the bits of the designated word register will be used to show/hide each channel. First bit (Bit-0) controls the first channel, second bit (Bit-1) controls the second channel, and so on. Display channel when the corresponding bit is: If [ON] is selected, when the corresponding bit is OFF, the channel is hidden. If [OFF] is selected, when the corresponding bit is ON, the channel is hidden. In the following example, the control address of channel visibility is set to LW-0 and each channel shows when the corresponding bit is OFF. If there are 5 channels, the visibility of the channels is as the following list: Channel 0 : Control address LW_bit-000 : Bit state OFF : Display YES Channel 1 : Control address LW_bit-001 : Bit state ON : Display NO Channel 2 : Control address LW_bit-002 : Bit state ON : Display NO Channel 3 : Control address LW_bit-003 : Bit state OFF : Display YES Channel 4 : Control address LW_bit-004 : Bit state OFF : Display YES |