Overview & Concepts
cMT Diagnoser is a diagnostic utility used with EasyBuilder Pro and cMT-series HMIs to monitor system activity and troubleshoot communication or runtime issues. It provides visibility into the internal operation of the HMI by displaying communication status, device activity, and system messages in real time. This allows engineers and technicians to identify problems with device connections, drivers, or project behavior during development and operation.
cMT Diagnoser collects and displays diagnostic information generated by the HMI while the project is running. This information helps users observe how the HMI is interacting with connected devices and how the project is executing.
Key diagnostic areas include:
- Communication activity – Displays polling activity and communication status between the HMI and connected devices.
- Device status monitoring – Shows the condition and connection state of configured devices.
- System and macro messages – Provides output messages that can help identify errors or operational events.
This tool is commonly used during project development, commissioning, and maintenance to verify communication, investigate abnormal behavior, or monitor system performance.
Implementation
How to Start cMT Diagnoser
cMT Diagnoser can be used in simulation mode or on HMI. When it is used on HMI, it can be opened from within cMT Viewer, or run an independent program named as cMT Diagnoser be directly opened on HMI.
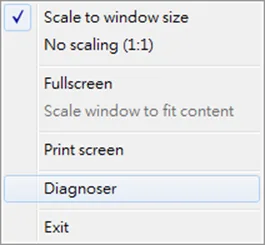
- In on-line/off-line simulation, cMT Diagnoser can be opened by clicking the right mouse button in cMT Viewer simulation screen and then click Diagnoser.
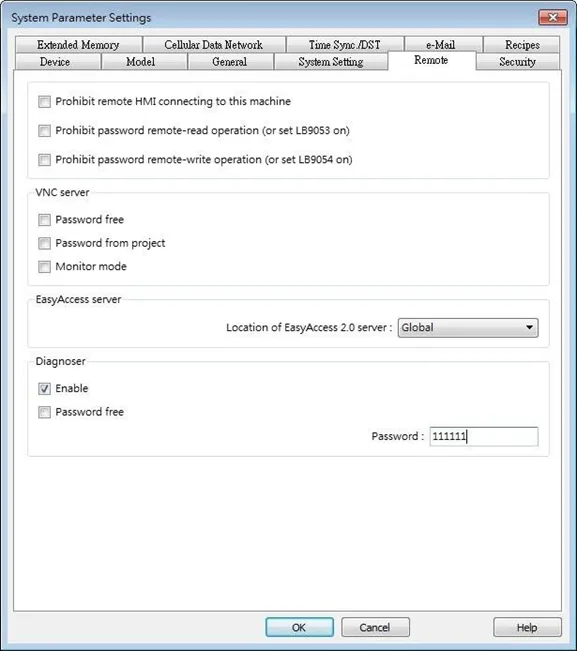
- To permit connection to HMI from cMT Diagnoser, enable the Diagnoser option which is found in the [System Parameters] » [Remote] tab in EasyBuilder Pro.
- After downloading the project to HMI, cMT Viewer can open cMT Diagnoser. If [Password free] is not selected in Remote tab in previous step, a password is required for running cMT Diagnoser. Default password is 111111.
![cMT Diagnoser main screen, showing password requirement. If [Password free] is not selected in Remote tab in previous step, a password is required for running cMT Diagnoser. Default password is 111111.](https://media.maplesystems.com/wp-content/uploads/2026/04/image-370.webp "Main cMT Diagnoser screen")
- Execute cMTDiagnoser.exe, which can be run independently, in EasyBuilder Pro installation directory, and find an HMI to connect to.

cMT Diagnoser User Interface
Object Settings
In the Object tab in cMT Diagnoser user interface, the objects used in the current window and their addresses, properties, and statuses are shown in a table.
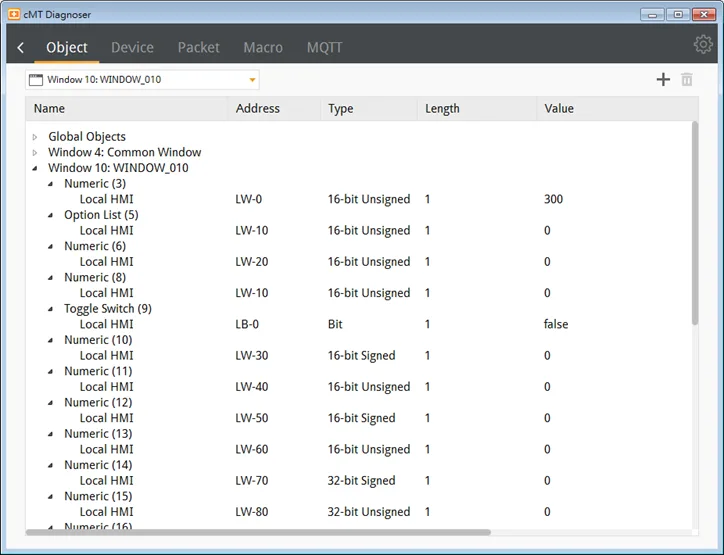
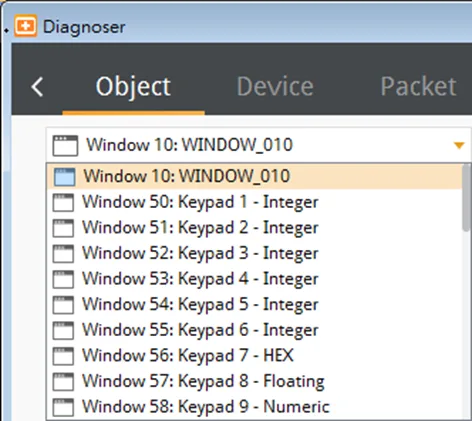
Selecting a window from the drop-down list can quickly change to another window.
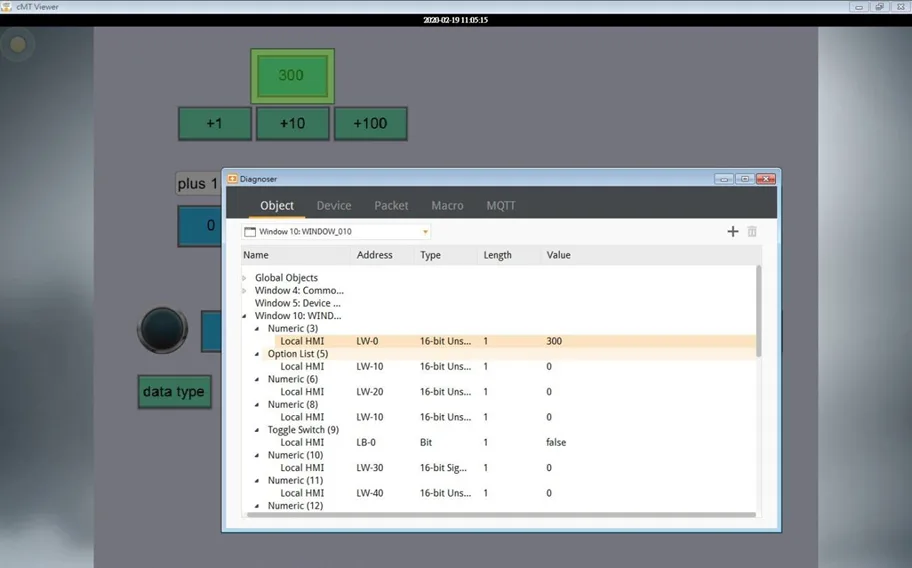
The object selected in the cMT Diagnoser window will be highlighted as shown below.
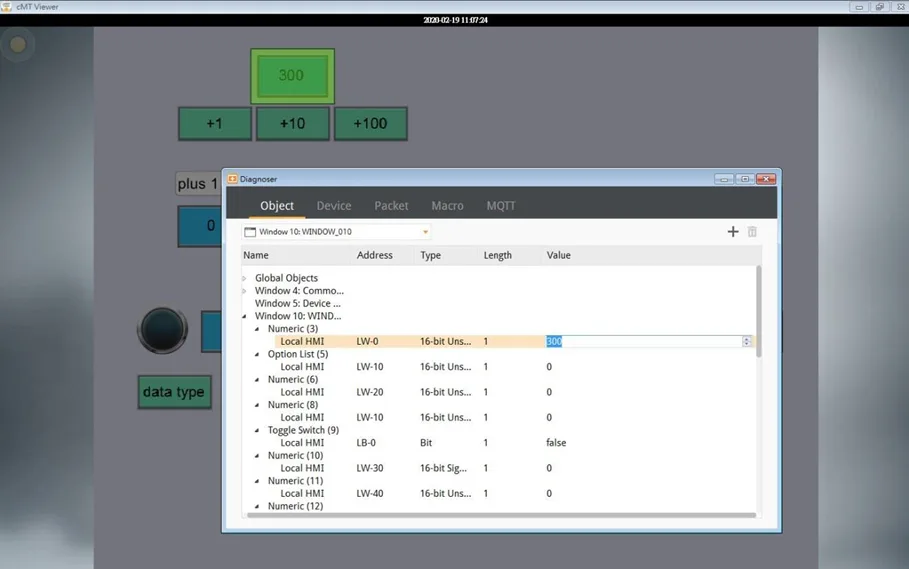
Double-click an object within the cMT Diagnoser window to change its value
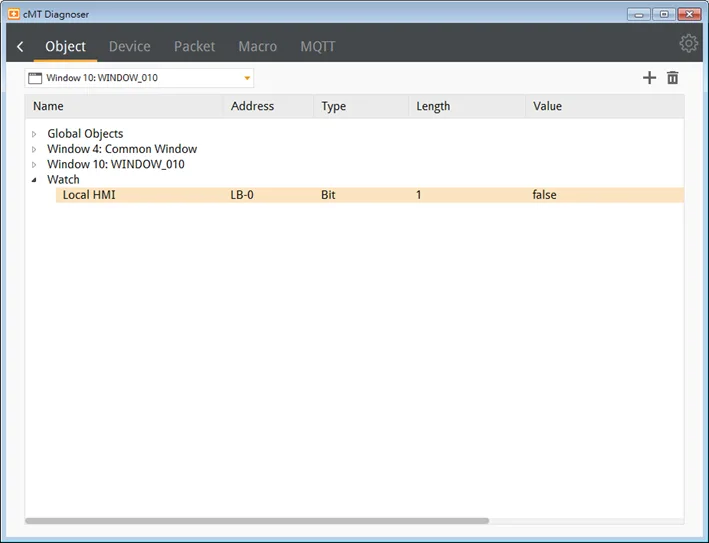
In cMT Diagnoser, watch addresses can be added or deleted. Click + to add a new address, or select an address and then click the trash can icon to delete it
Device Settings
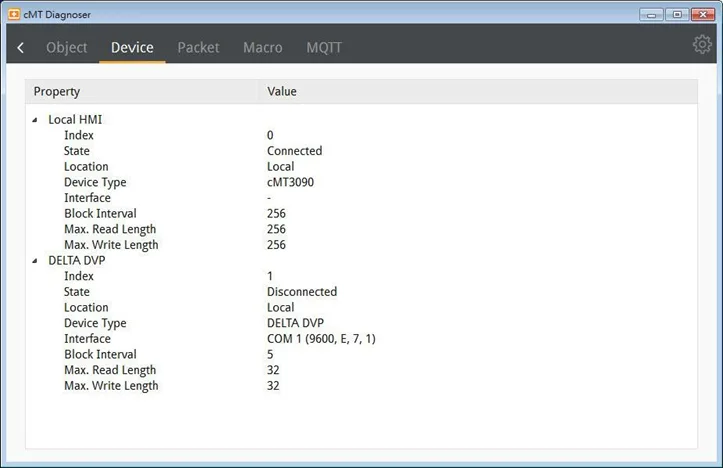
The state and property of the device communicating with HMI is shown in the Device tab.
Packet Settings
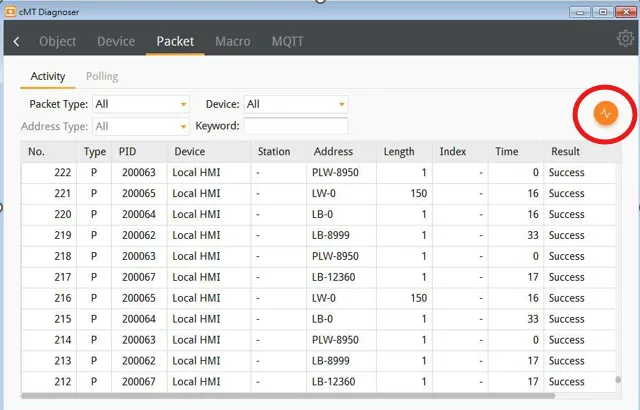
In the Packet tab, select the ranges and then click the graph icon (circled below) to observe communication status between HMI and PLC.
| Item | Description |
|---|---|
| Packet Type | All Displays all packets in Activity area. Read Displays only Read packets in Activity area. Write Displays only Write packets in Activity area. Polling Displays only Polling packets in Activity area. |
| Device | All Displays the information of Local HMI and PLC. Local HMI Displays the information of Local HMI. PLC Displays the information of PLC. |
| Station | Selects the PLC station number to be displayed. (This function is disabled when selecting [All] in [Device].) |
| Address Type | Selects all or a preferred address type to be displayed. (This function is disabled when selecting [All] in [Device].) |
| Keyword | Displays information that contains the keyword entered. |
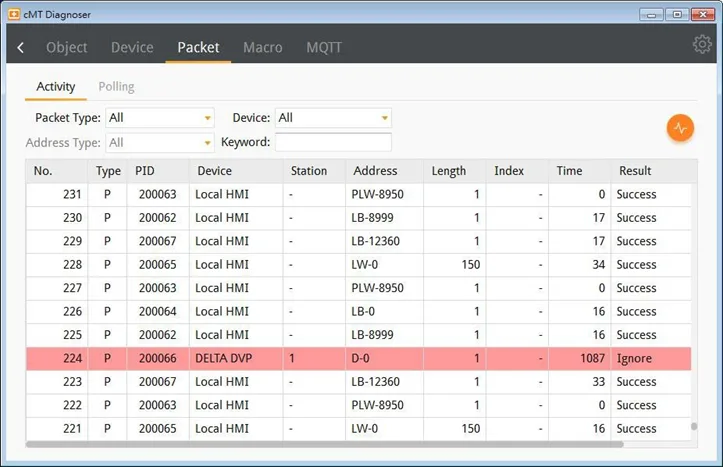
If a communication error occurs, information relating to the error will be highlighted in red in the Activity page, and the cause of error is shown in the Result column.
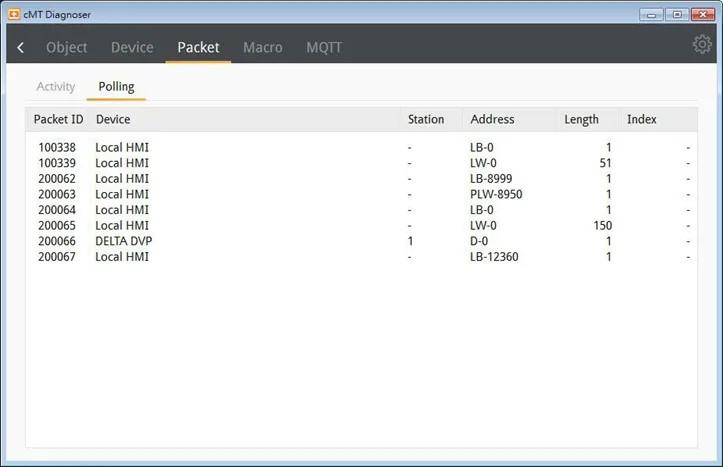
The Polling page shows the information of the polling packets periodically sent from HMI, including the start address, length…etc.
| Item | Description |
|---|---|
| Packet ID | Use the Packet ID to find the invalid object. |
| Device | Displays HMI and PLC type. |
| Station | Displays PLC station number. |
| Address/Length | Displays the device type and the size of the packet. |
| Index | Displays the index register number of the object. |
Macro Settings
Execute and test macros.
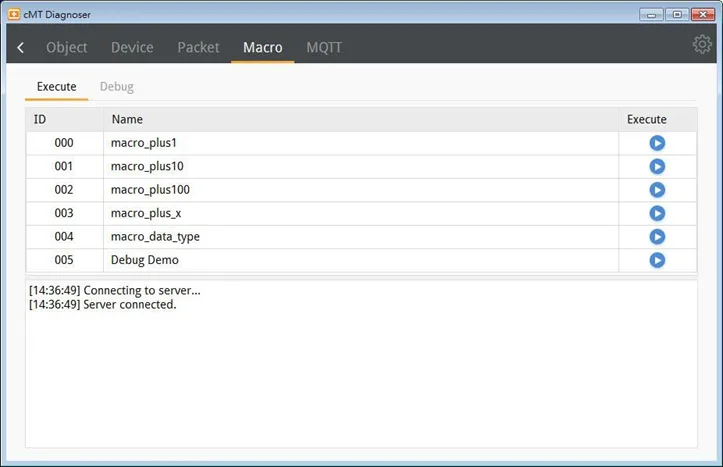
Macro Debugger Tool
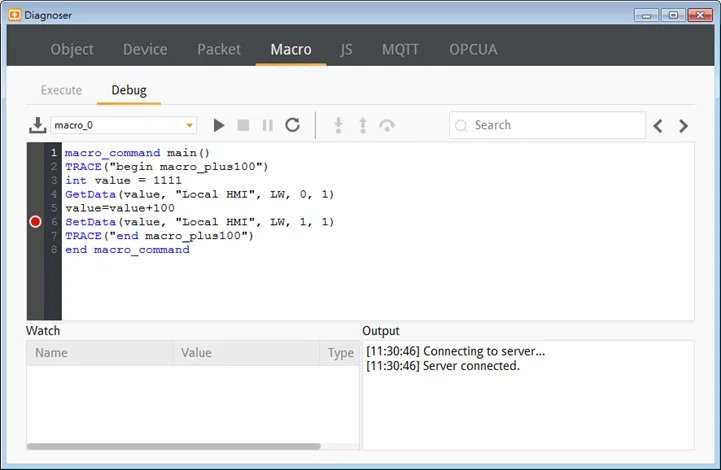
| Item | Description |
|---|---|
| Load macro debug file | Macro Debug File can be generated when compiling a project file in EasyBuilder Pro, and it is placed in the same directory as the compilation file. Macro Debug File has a file name extension of “.debug”. When an unmatched debug file is loaded, the error message window shows. |
| Start debugging | Start debugging or execute macro from a breakpoint. |
| Stop debugging | Stop debugging. |
| Break | Pause macro debugging manually. A Breakpoint can be set at a statement by clicking the grey margin on the left-hand side of the statement. When a macro is launched, it will run until the Breakpoint, and wait for the next command. |
| Restart simulation | After running on-line / off-line simulation in macro work space, the macro can be revised directly in the Diagnoser window. After revising the macro, the simulation can be restarted by clicking Restart Simulation, and then the confirmation window pops up. |
| Step Into | Run the macro line by line. If the line contains a function, the diagnoser will enter the called function and continue line-by-line debugging from there. |
| Step Out | Return to the line where the current function was called. |
| Step Over | Run the macro line by line. If the line contains a function, the function will be executed and the result is returned without debugging each line. |
| Search | Search for a macro by entering keywords. |
| Watch | When debugging, variables can be added here for watching the change of data. |
| Output | Shows system information or TRACE output. |
Macro Debug in cMT Diagnoser can be opened in the following ways, each with different privilege requirements and operation steps.
Method 1: [On-line Debug] or [Off-line Debug] within macro editing work space
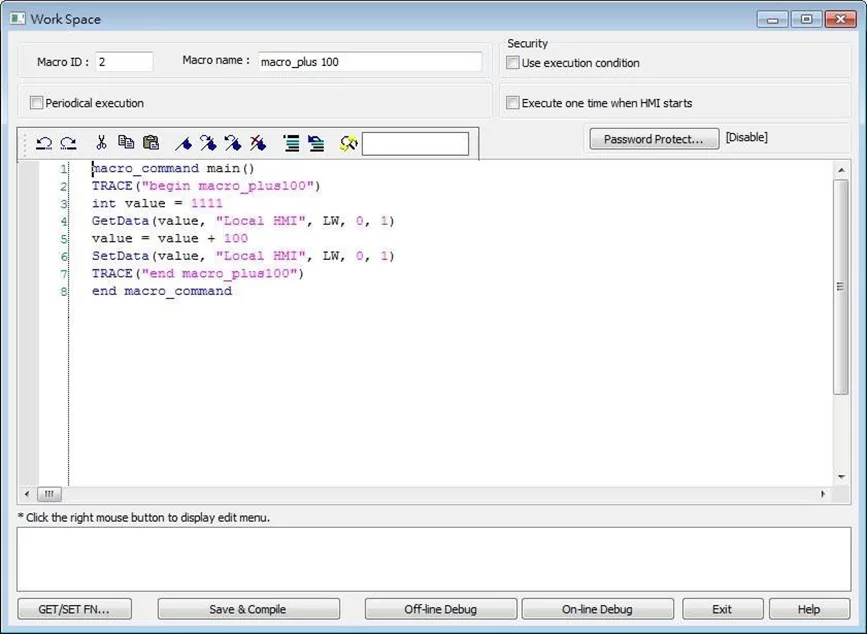
Click [On-line Debug] or [Off-line Debug].
Software will generate a Macro Debug File. Also, macro editing work space window will close and be replaced by cMT Viewer simulation and cMT Diagnoser, the latter of which loads the Macro Debug File automatically. When the macro is being debugged in cMT Diagnoser’s, the macro codes can actually be modified.
Upon completing macro debugging, close the cMT Viewer simulation. The macro editing work space should appear again, and it will ask whether you want to update the macro with the changes made in cMT Diagnoser.
Method 2: On-line simulation / Off-line simulation in EasyBuilder Pro.
The Macro Debug File is automatically generated after compiling the project file. When cMT Viewer simulation window is shown by running simulation in EasyBuilder Pro, open cMT Diagnoser from the right-click menu. The system imports the debug file automatically when it detects one. In simulation mode, macro can only be debugged but not changed.
Note:
- There must be at least one macro in the project for the Macro Debug File to be generated during compilation.
Debugging Example
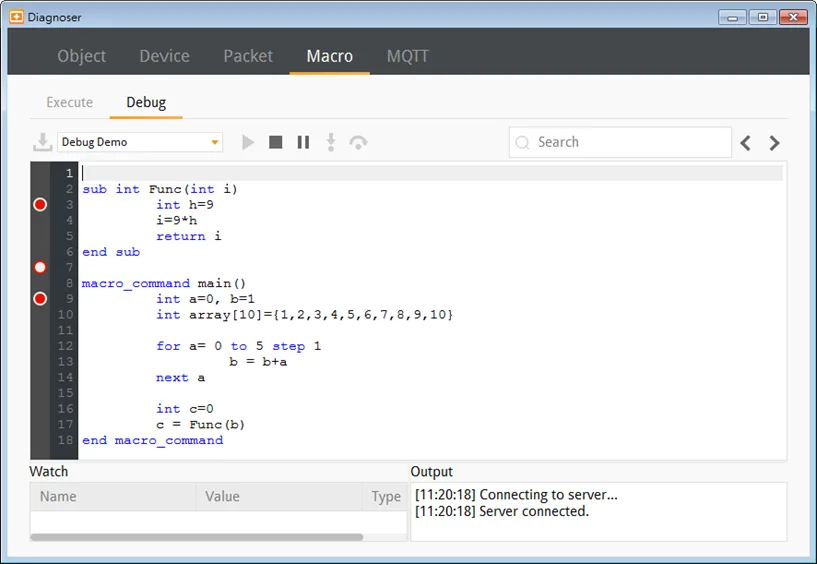
Here is a debugging example using the “Start Debugging” tool within the cMT Diagnoser Macro tab.
Instructions: Debugging Example
Start Debugging
Click [Start Debugging]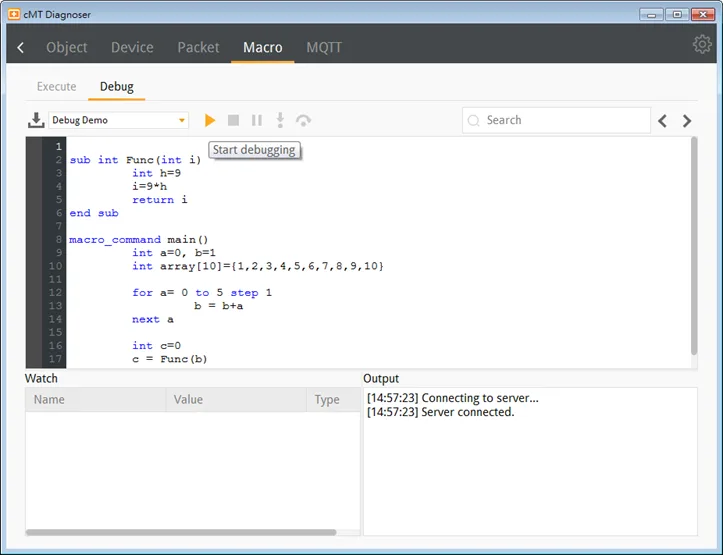
Set breakpoints
Set Breakpoints in the grey margin on the left-hand side of the lines. The Breakpoints are represented by red dots.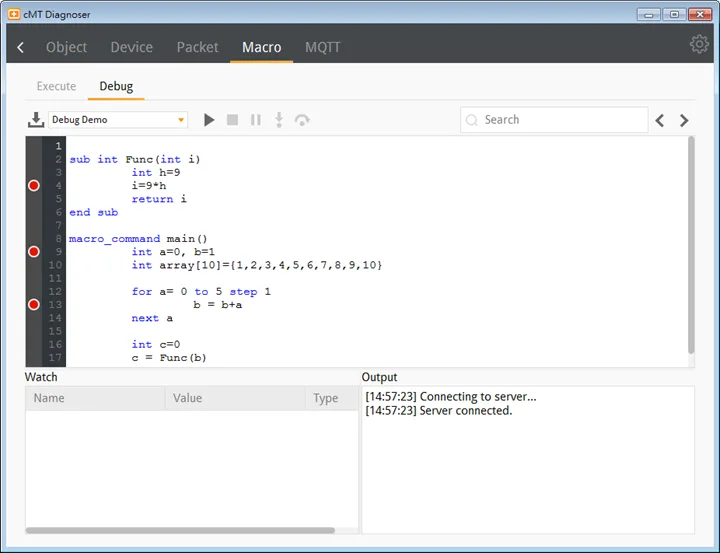
Macro runs, stops @ break points
After debugging is started, it will stop at the first breakpoint, now marked by a yellow arrow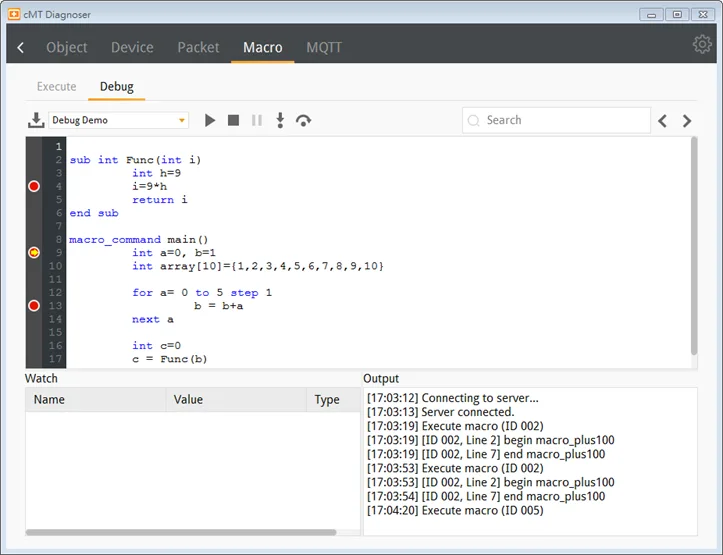
Monitor Variables
At this moment, variables can be added monitored in the Watch table as shown below. Contents of arrays can be monitored as well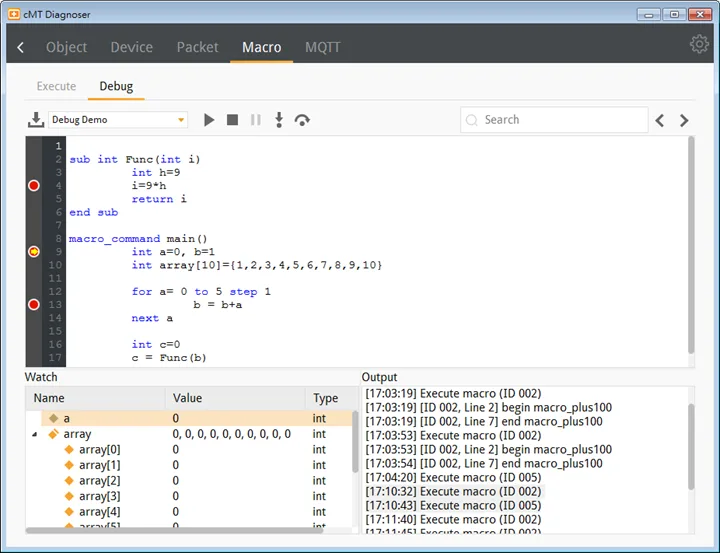
click “Start Debugging” again to continue
After the Start Debugging button is clicked once again, macro will run and stop at the next breakpoint. The changes of values are shown in the Watch list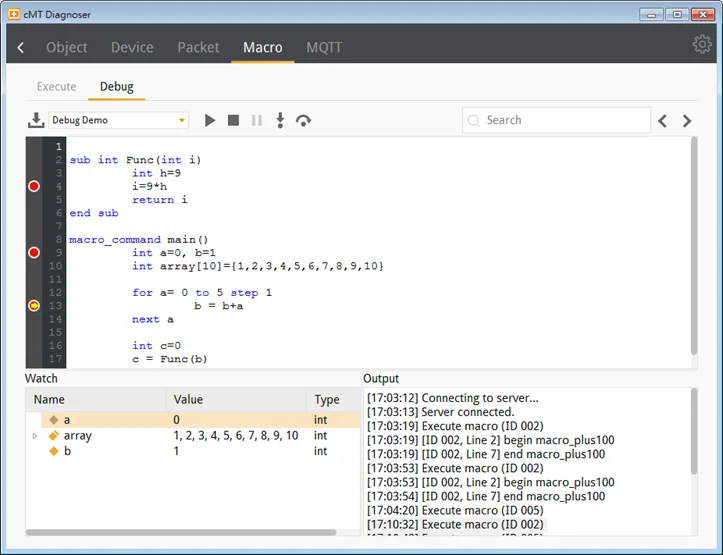
“Step Into” button for line by line debugging (including functions)
Click the Step Into button to run macro debugging line by line. If the line contains a function, cMT Diagnoser will enter the called function and continue line-by-line debugging from there. Changes of values can be observed in the Watch table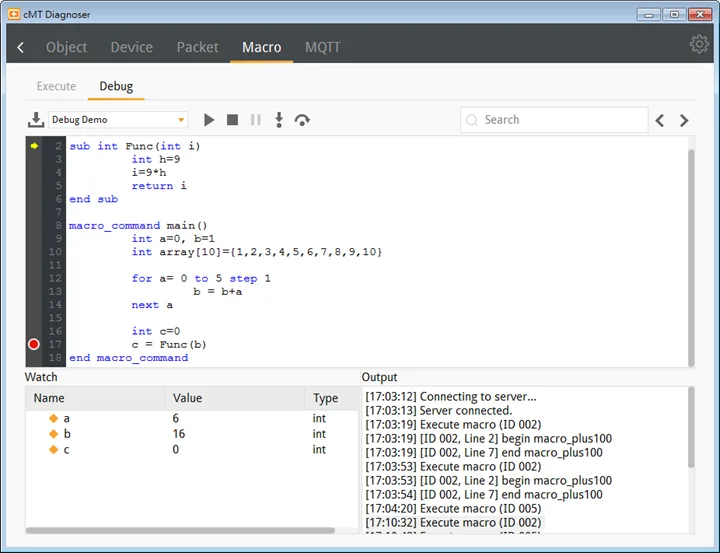
“Step Over” button for line by line debugging (excluding functions)
Click the Step Over button to run the macro line by line. Now, if the line contains a function, the result will be returned without debugging each line within the function call. When debugging meets a Breakpoint within the function call though, it stops there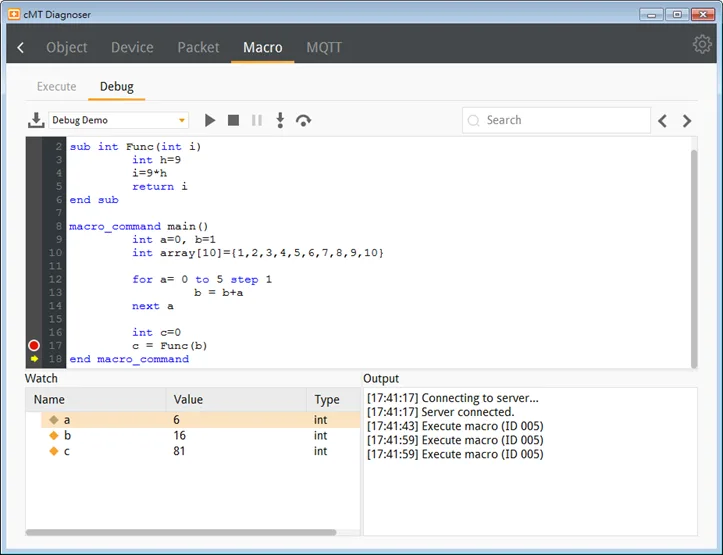
Stop Debugging
Click Stop Debugging button to stop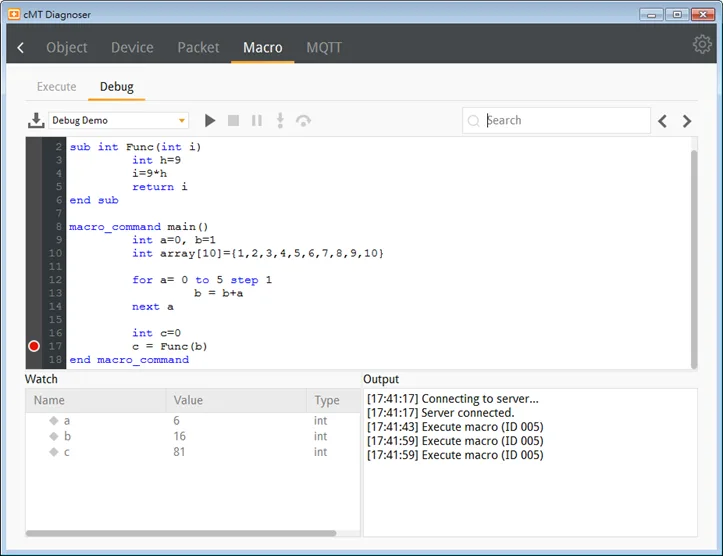
MQTT Settings
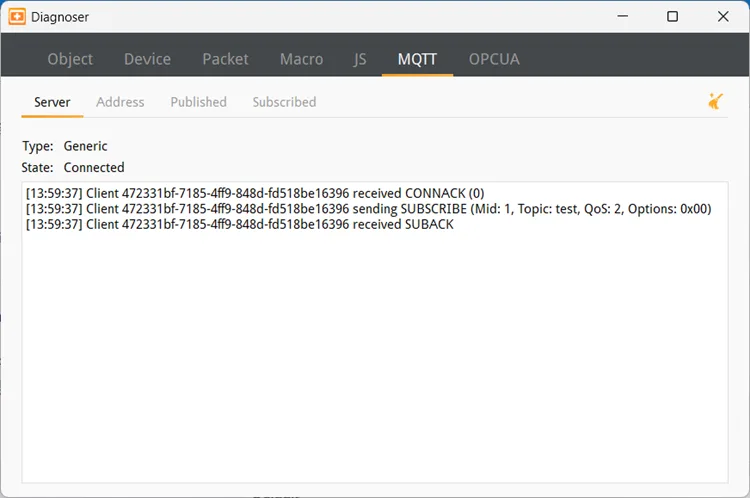
In Server tab the type and state of MQTT server is shown. Supported cloud services include: Generic / Azure IoT Hub / Sparkplug. Please note that AWS IoT is not supported.
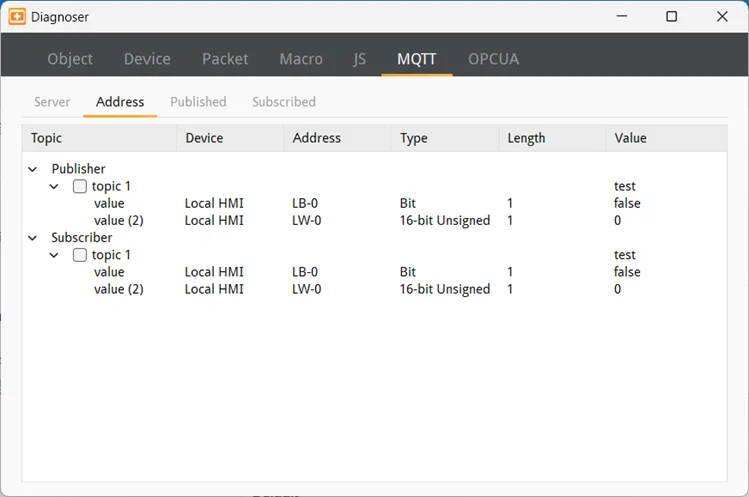
In Address tab the Topics published and subscribed by the HMI are shown. Selecting the checkbox of a topic in this tab can make cMT Diagnoser receive all MQTT messages published and subscribed, allowing cMT Diagnoser to change address data for easier MQTT debugging. Only generic servers are supported.
Note:
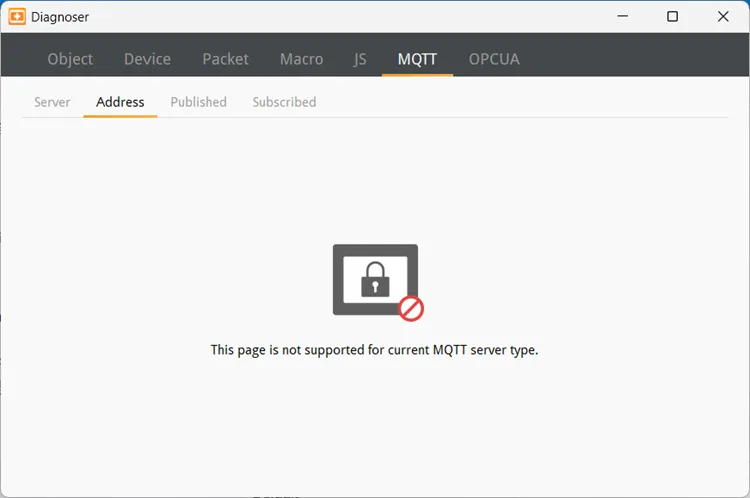
- If a non-generic server is used, the following screen will appear.:
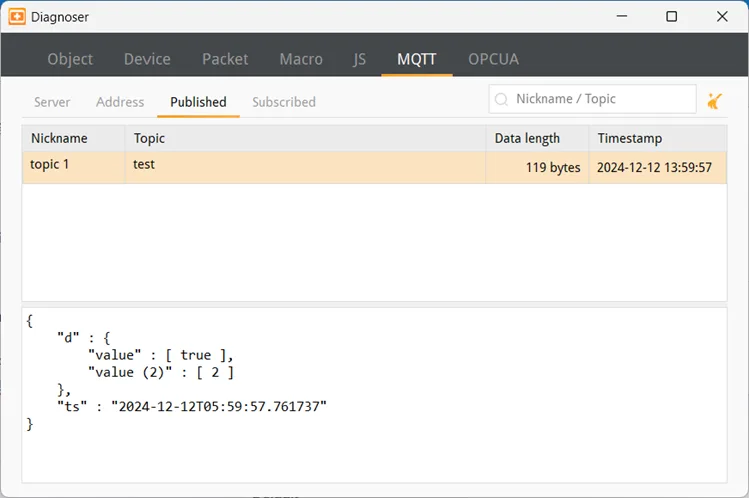
In Published tab the message published from HMI is shown. When Raw Data is used as content format, data will be shown in hexadecimal. Only generic servers are supported.
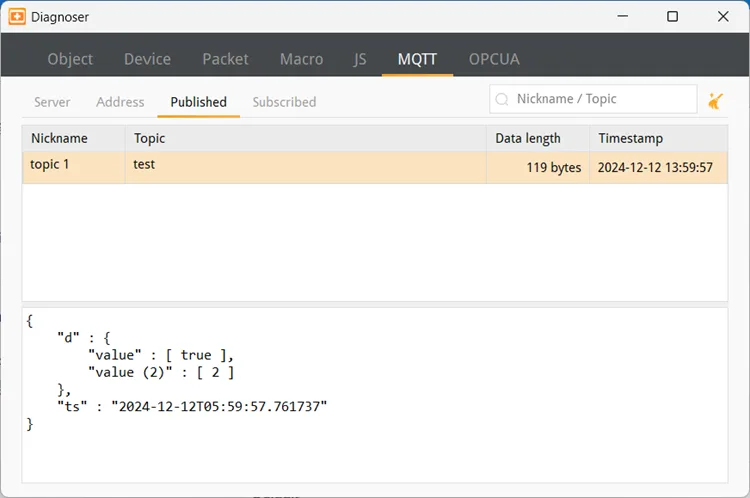
In Subscribe tab the message subscribed by HMI is shown. When Raw Data is used as content format, data will be shown in hexadecimal. Only generic servers are supported.
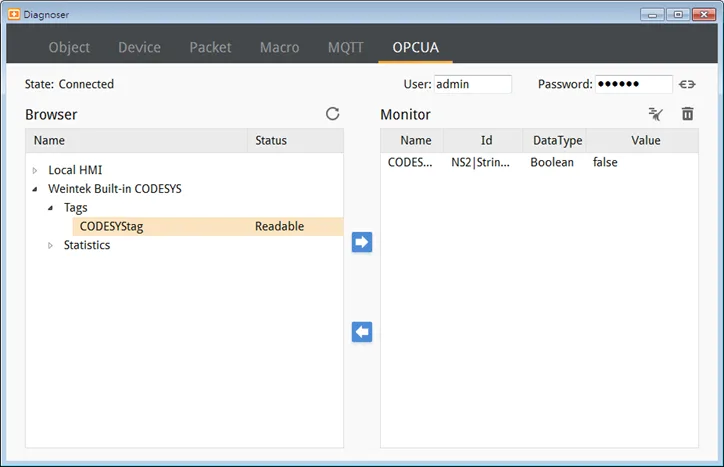
OPC UA Settings
Users can log in by entering the credentials to monitor values of OPC UA nodes.
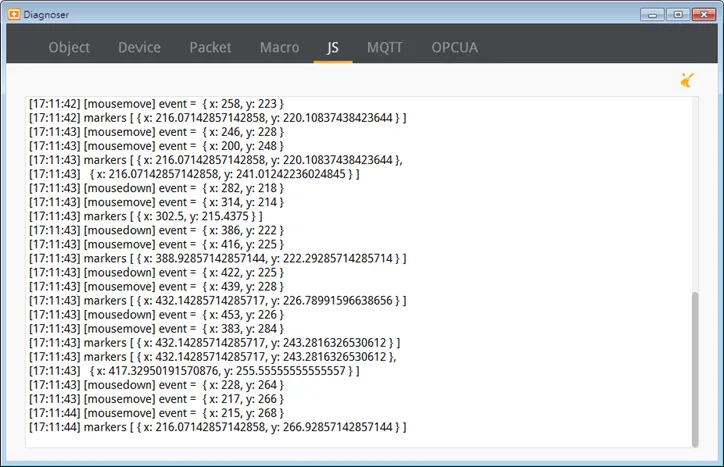
JS / JavaScript Settings
In this tab users can view console messages of JS objects
Notes:
- cMT Diagnoser supports the monitoring all PLC addresses that HMI can access, including Tag PLC addresses.
- Address values can be displayed in Decimal/HEX/Binary formats. Right-click anywhere on a monitor page to bring the menu up for the change.
- When closing cMT Viewer with cMT Diagnoser opened, cMT Diagnoser will resume last state and pops up when cMT Viewer simulation window opens again. If Diagnoser is closed before closing cMT Viewer, users should manually open Diagnoser in next simulation.
- When monitoring cMT-SVR/cMT-SVRX models, connecting directly with cMT Diagnoser displays only global object information. To view information for objects within the current window, connect through cMT Viewer and access Diagnoser with a right-click.
- When [Password Protect] is enabled in Macro Manager, the Macro Debug File cannot be generated after compilation.
- Password Protect can be enabled for an individual macro, and two modes are available: Encrypted and Read Only. To debug a password protected macro, a password is required to unlock the macro in cMT Diagnoser. If the macro is protected in Read Only mode, it can only be viewed but not changed when debugging. If the macro is protected in Encrypted mode, it cannot be viewed at all.
- When a macro is not successfully compiled, it will be put into the Macro Under Development list and will not be contained in the Macro Debug File.
- cMT Diagnoser can only debug one macro at a time. When debugging a macro, executing another macro will not be effective.
- When the breakpoint is placed on irrelevant lines, such as beside an empty line , variable declaration without initial value assignment, the breakpoint will be represented by a hollow red dot as line 7 below shows: