
Trending Objects
There are several screen objects that allow you to view either historical logged data or real-time information.

Real Time Trend
The Trend object represents up to four target tag registers on an X/Y plot with values recorded versus time. Registers can be consecutive or chosen individually. Values plot according to a predefined time interval or using a time interval as specified by a PLC register. Values can be read from 8/16/32 bit registers in signed/unsigned, BCD, or floating-point format.
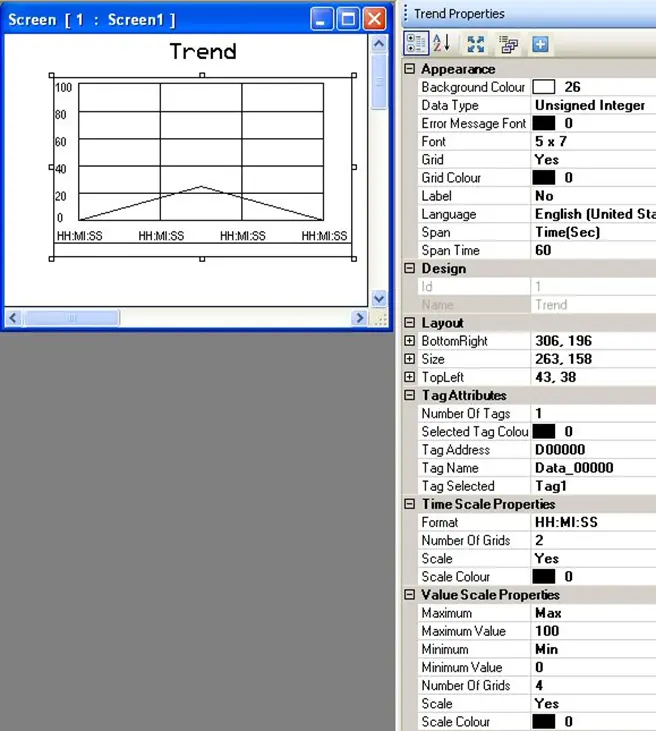
Place a Trend object on screen
- Use one of the following:
- click Draw > Display Objects > Real Time Trend from the standard menu
- click Advanced Objects > Trend from the Draw toolbar
- Move cursor to a start point for the Trend Graph object. Click and hold mouse cursor.
- Drag mouse cursor to an end point for the Trend Graph object and release. The object appears on screen and the Trend Properties box displays.
Trend Properties Options
- Appearance section – these attributes determine the general look of the trend.
- Background (HMC4000 only) – Allows you to choose between using a solid background color, or a background theme
- Background Theme (HMC4000 only) – if you have “Background Theme” selected, allows you to select a theme for your trend display.
- Background Color – determines the fill or background color of the trend graph. Click the button to display the color palette and select a color.
- Data Type (description) – select the data format used for the values associated with the trend.
- Error Message Font Color (HMC2000 only) – determines the color of any error messages that may appear during the execution of the trend graph. Click the button to display the color palette and select a color.
- Font (HMC2000 only) – used to configure the pixel size (WxH) of the error message. Options are 5×7 and 7×14 pixels.
- Note: error messages that do appear display along the bottom of the trend graph.
- Grid – option to display grid lines on the trend graph
- Grid Color – determines the color of the grid lines. Click the button to display the color palette and select a color.
- Span Time – if Time (sec) is selected above, enter the pre-defined length of time (range is 0 to 65536) in seconds.
- Span Time Tag Name – if Tag Selected is chosen for Span above, this is the tag used to populate the span time in the Tag Database. Time period is seconds and the value read must be in the range of 0 to 65535.
- Background (HMC4000 only) – Allows you to choose between using a solid background color, or a background theme
- Label (HMC2000 only) – option to have a text label appear on the top of the trend.
- Label Font – determines the font type, size, etc.
- Name – Type font used
- Size – select font size
- Bold – select ‘True’ to enable
- Italic – select ‘True’ to enable
- Underline – select ‘True’ to enable
- Label Text – enter the text to appear in the label. Maximum of 12 characters in length.
- Label Text Color – determines the text color of the label. Click the button to display the color palette and select a color.
- Language – highlight the language that must be selected to display the entered text.
- Span – options are Time (sec) or Tag Selected. Select Time (sec) to configure a pre-defined length of time (in seconds) for the values plotted on the trend graph. Use Tag Selected to configure a PLC target address continuously read by the HMC to determine the length of time used by the trend graph.
- Label Font – determines the font type, size, etc.
- Design – identifies object.
- Layout – coordinates (i.e. size and position) for the object.
- Tag Attributes section – use this section to configure the number of trend lines (target tag addresses) and colors.
- Number of Tags – this is the total number of tags or channels represented on the trend graph. A channel is a line on the graph that represents the value of a target register at a particular point in time. Range is 1 to 4 tags.
- Pen Size – this determines the thickness of the trend line on the graph, can be anything from 0-5.
- Selected Tag Color – this is the color of the channel line for the selected tag (see Tag Selected below). Click the button to display the color palette and select a color.
- Tag Name – this is the name given to the tagged register in the Tag Database.
- Tag Selected – After Number of Tags is specified above, select each Tag from the pull-down list box to configure the target Tag Address and color of the trend line
- Time Scale Properties section – determines the layout of the X time axis.
- Format – select hours, minutes, seconds (HH:MM:SS) or hour, minutes (HH:MM).
- Number of Grids – indicate the total number of grids that indicate time intervals (along the x-axis) on the trend graph. Range is 1 to 10.
- Scale – enable to display the time scale.
- Scale Color – Click the button to display the color palette and select a color to display the time scale.
- Value Scale Properties – sets the attributes for the Y-axis.
- Maximum – options are Max or Tag. Select Max to configure a pre-defined maximum value range on the trend graph. Use Tag to configure a PLC target address continuously read by the HMC to determine the maximum range used by the trend graph.
- Maximum Value – if “Max” is selected above, enter the maximum value when read from the target register indicates the highest point on the trend graph.
- Maximum Tag Name – this is the tag name of target register continuously read by the HMC to determine the maximum range.
- Minimum – options are Min or Tag. Select Min to configure a pre-defined minimum value range on the trend graph. Use Tag to configure a PLC target address continuously read by the HMC to determine the minimum range used by the trend graph.
- Minimum Value – if “Min” is selected above, enter the minimum value when read from the target register indicates the lowest point on the trend graph.
- Minimum Tag Name – this is the tag name of target register continuously read by the HMC to determine the minimum range.
- Number of Grids – indicate the total number of grids that indicate the values (along the y-axis) recorded on the trend graph. Range is 1 to 10.
- Scale – enable to display the value scale.
- Scale Color – Click the button to display the color palette and select a color to display the value scale
Resize a Trend object
Move the mouse pointer over one of the resize handles. When the pointer changes to a double-headed arrow, simply click and drag to a new location.

Historical Trend
The Historical Trend object represents up to four target tag registers on an X/Y plot with values recorded versus time. Registers can be consecutive or chosen individually. Values plot according to a time interval specified in the target Start/End Time Tag registers. Values are read from 8/16/32 bit registers in signed/unsigned, BCD, or floating-point format. The Historical Trend graph differs from the Real-Time Trend graph listed above in that the Historical Trend receives data from the Data Logger instead of real-time values taken from the PLC. Therefore, you must configure a group of DataLog registers in the Data Logger before you configure a Historical Trend graph.
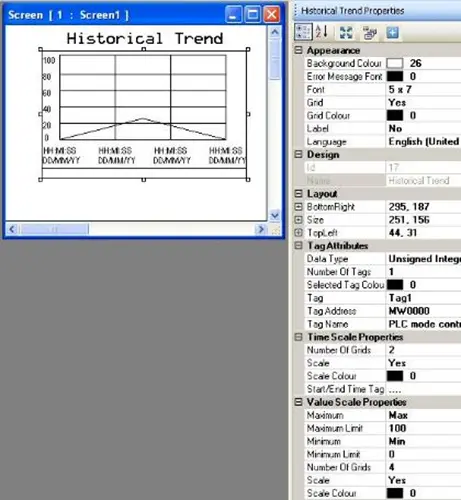
Place a Historical Trend object on screen
- Use one of the following:
- Click Draw > Display Objects > Historical Trend from the standard menu
- Click Advanced Objects > Historical Trend from the Draw toolbar
- Move cursor to a start point for the Historical Trend Graph object. Click and hold mouse cursor.
- Drag mouse cursor to an end point for the Historical Trend Graph object and release. The object appears on screen and the Historical Trend Properties box displays.
- Note: Before you can place a historical trend graph on the screen, you must first configure the Data Logger.
Historical Trend Properties Options
- Appearance section – these attributes determine the general look of the historical trend graph.
- Background (HMC4000 only) – Allows you to choose between using a solid background color, or a background theme
- Background Theme (HMC4000 only) – if you have “Background Theme” selected, allows you to select a theme for your trend display.
- Background Color – determines the fill or background color of the historical trend graph. Click the button to display the color palette and select a color.
- Error Message Font Color (HMC2000 only) – determines the color of any error messages that may appear during the execution of the historical trend graph. Click the button to display the color palette and select a color.
- Font (HMC2000 only) – used to configure the pixel size (WxH) of the error message. Options are 5×7 and 7×14 pixels.
- Note: error messages that do appear display along the bottom of the trend graph.
- Grid – option to display gridlines on the historical trend graph
- Grid Color – determines the color of the gridlines. Click the button to display the color palette and select a color.
- Label (HMC2000 only) – option to have a text label appear on the top of the historical trend.
- Label Font – determines the font type, size, etc.
- Name – Type font used
- Size – select font size
- Bold – select ‘True’ to enable
- Italic – select ‘True’ to enable
- Underline – select ‘True’ to enable
- Label Text – enter the text to appear in the label
- Label Text Color – determines the text color of the label. Click the button to display the color palette and select a color.
- Label Font – determines the font type, size, etc.
- Language – highlight the language that must be selected to display the entered text
- Background (HMC4000 only) – Allows you to choose between using a solid background color, or a background theme
- Design – identifies object
- Layout – coordinates (i.e. size and position) for the object
- Tag Attributes section (HMC4000) – use this section to configure the number of trend lines (target tag addresses) and colors.
- Date – Choose whether or not to display dates on the historical trend.
- Time – Choose whether or not to display timestamps on the historical trend.
- Display Style – Select Actual or percentage value for display on the graph.
- Group – Choose which Data Logger group to display
- NOTE: If you change the group, then any previous group settings will be reset
- Group Settings – Opens a “Group Configuration” dialog box where you can configure settings for how the Data Logger group displays on the trend
- Sample Rate Per Frame – Sets the number of samples per frame
- Style – Select a graphical or Tabular style for the historical trend diagram
- Graphical – Display the trend diagram as a trend graph, same as the HMC2000 series
- Tabular – Display the trend diagram as a table of values. When this mode is selected, many of the parameters are removed or simplified
- Serial Number – Choose whether or not to display the serial number in the table
- Display last record First Bit – Choose whether or not to display the last record First Bit
- Everything after this bit is removed from the HMC4000s save for the “Start/End Time Tags settings”
- Tag Attributes section (HMC2000)
- Data Type (description) – select the data format used for the values associated with the trend.
- Number of Tags – this is the total number of tags or channels that are represented on the historical trend graph. A channel is a line on the graph that represents the value of a target register at a particular point in time. Range is 1 to 4 tags.
- Selected Tag Color – this is the color of the channel line for the selected tag (see Tag below). Click the button to display the color palette and select a color.
- Tag – After Number of Tags is specified above, select each Tag from the pull-down list box to configure the target Tag Address and color of the trend line.
- Tag Name – this is the tag that is read by the HMC to determine the historical trend graph level.
- Note: Only tags that have been configured in the Data Logger are displayed as options. Also note that the Historical Trend Graph does not read the current value in the tag – to do that you need to use a Real-time Historical Trend Graph. Rather, upon displaying the screen with the Historical Trend Graph, the HMC will read the recorded data values for the selected tag in the Data Log memory according to the Start/End Time Tag Settings below. If the Data Logger has no data recorded for the specified tag during the Start/End Times selected, than no trend line is drawn. The Historical Trend Graph is updated only when the screen is ‘refreshed’ using a function key or Multi-State button configured as Key’s Specific Task-Refresh All Trends or when the screen is initially displayed.
- Time Scale Properties section – determines the layout of the X time axis.
- Number of Grids – indicate the total number of grids that indicate time intervals (along the x-axis) on the trend graph. Range is 1 to 10.
- Scale Color (HMC2000 only) – Click the button to display the color palette and select a color to display the time scale.
- Start/End Time Tags settings – configure the target registers that the HMC monitors to determine the Start and End time scales (both Date and Time) that are represented on the Historical Trend graph. Click the button to display the Start/End Time Tag Settings dialog box. Each Start and End time requires the following:
- DD – a 16-bit register that is read to determine the day of the month (range: 1-31)
- MM – a 16-bit register that is read to determine the month of the year (range: 12)
- YY – a 16-bit register that is read to determine the year (range: 00-99)
- hh – a 16-bit register that is read to determine the hour (range: 0-23)
- mm – a 16-bit register that is read to determine the minute (range: 0-59)
- ss – a 16-bit register that is read to determine the second (range: 0-59)
- Time Scale – Displays or hides the “Time” axis scale.
- Time Scale Color (HMC4000 only) – Sets the color of the “Time” axis scale.
- Value Scale Properties – sets the attributes for the Y-axis
- Maximum (HMC2000 only) – options are Max or Tag. Select Max to configure a pre-defined maximum value range on the trend graph. Use Tag to configure a PLC target address continuously read by the HMC to determine the maximum range used by the trend graph.
- Maximum Limit (HMC2000 only) – if “Max” is selected above, enter the maximum value when read from the target register indicates the highest point on the trend graph.
- Maximum Tag Name (HMC2000 only) – If “Tag” is selected in “Maximum” this is the tag name of target register continuously read by the HMC to determine the maximum range.
- Minimum (HMC2000 only) – options are Min or Tag. Select Min to configure a pre-defined minimum value range on the trend graph. Use Tag to configure a PLC target address continuously read by the HMC to determine the minimum range used by the trend graph.
- Minimum Limit (HMC2000 only) – if “Min” is selected above, enter the minimum value when read from the target register indicates the lowest point on the trend graph.
- Minimum Tag Name (HMC2000 only) – If “Tag” is selected in “Minimum” this is the tag name of target register continuously read by the HMC to determine the minimum range.
- Number of Grids – indicate the total number of grids which are used to indicate the values (along the y-axis) recorded on the historical trend graph. Range is 1 to 10.
- Value Scale – enable to display the value scale.
- Scale Color – Click the button to display the color palette and select a color to display the value scale
Resize a Historical Trend object
Move the mouse pointer over one of the resize handles. When the pointer changes to a double-headed arrow, simply click and drag to a new location.

XY Plot (single and multi-point)
XY Plot (single point): Plot the value in one register against the value in another register. A single point is displayed on the plot, the position of the point changes as the values in the registers change over time. Reference lines can be added to the grid to help determine if the data points are within an acceptable range. An error message will display along the bottom of the plot when values are read that are outside the specified grid range.
XY Plot (multipoint): In this mode, data points (historic) previously recorded are not erased when new data points (current) are read. Up to 100 historic data points can be displayed. Data can be retentive so that it is maintained even if power is removed from the HMC. When the Data Point with Line and Line Only features are used, a line is drawn between each data point.
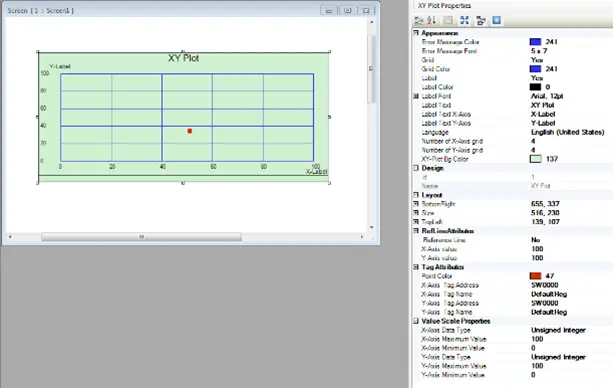
Place an XY Plot object on screen
- Use one of the following:
- Click Draw > Display Objects > XY Plot from the standard menu
- Click Advanced Objects > XY Plot from the Draw toolbar
- Move cursor to a start point for the XY Plot object. Click and hold mouse cursor.
- Drag mouse cursor to an end point for the XY Plot object and release. The object appears on screen and the XY Plot Properties box displays.
XY Plot Properties Options
- Appearance section – these attributes determine the general look of the trend.
- Plot Type (HMC4000 only) – Switch the XY plot between a single and multi-point plot.
- Drawing Points (HMC4000 only) – When multi-point is selected, acts as the “Number of Points” option in the HMC2000 version.
- Error Message Color – Color of error message displayed when X and Y values are invalid.
- Error Message Font – Font of error message displayed when X and Y values are invalid.
- Grid – display horizontal and or vertical lines on the plot area.
- Grid Color – Color of grid lines.
- Label – Select whether or not the XY Plot will have a label.
- Language – Select the language for the label.
- Number of X-Axis grid – Number of vertical grid lines to display on the plot area.
- Number of Y-Axis grid – Number of horizontal grid lines to display on the plot area.
- XY-Plot Bg Color – Color of XY Plot area background.
- Plot Type (HMC4000 only) – Switch the XY plot between a single and multi-point plot.
- Layout – coordinates (i.e. size and position) for the object.
- Ref Line Attributes – Configure up to 3 reference lines to display over the top of the XY Plot area. on the HMC2000 series, this is only available on single point plots. On the HMC4000, these options are available for both single and multi-point plots.
- Reference Line – Enable (Yes) or disable (No) the reference line feature.
- Number of Ref. Lines – Indicate the number of reference lines to be displayed on the Plot. Range is 1 to 3.
- Ref. Line Selected – Select which reference line’s properties are currently displayed for editing.
- Ref. Line Crossover Detection – When this property is enabled, for the selected Reference line, a bit is set or cleared depending on which side of the reference line the point is on. The bit will be true when the point is to the left of the reference line, and off when the bit is to the right of the line.
- Note: If 3 non-linear points are used for the reference line, unexpected behavior of crossover detection may occur.
- Ref. Line TagAddress of Crossover Detection – Address of the Boolean tag that is set when the selected reference line is crossed. This property is only available when Show Crossover Detection is enabled.
- Ref. Line TagName of Crossover Detection – Tag name of the Boolean tag that is set when the selected reference line is crossed. This property is only available when Show Crossover Detection is enabled.
- Ref. Line Type – Select appearance of the Reference line. Options: Continuous, Dashed
- Ref. Line Color – Select the color for the reference line
- Ref. Line Label – Display a label corresponding to the selected reference line
- Ref. Line Number of Points – Number of points used to define the slope and offset of the reference line. Range is 2 to 3. The slope of the reference line is determined by specifying a number of points along the line. Points can be specified by entering the X and Y coordinates for each point or by designating tags that contain the coordinates.
- Ref. Line Selected Point – Select the point to configure. Each point will be given an X and Y coordinates using the properties that follow.
- X-Axis Maximum of Reference Line – Select whether to enter a value for the X-Axis coordinate of this point (Max) or select a tag that will contain the value of the X coordinate (Tag)
- X-Axis value – If Max is selected above, enter the X coordinate for this point
- X-Axis Tag Name – If Tag is selected in the property above, specify the tag that will contain the X-Axis coordinate of this point
- Y-Axis Maximum of Reference Line – Select whether to enter a value for the Y-Axis coordinate of this point (Max) or select a tag that will contain the value of the Y coordinate (Tag)
- Y-Axis value – If Max is selected above enter the Y coordinate for this point
- Y-Axis Tag Name – If Tag is selected in the property above specify the name of the tag that will contain the Y-Axis coordinate of this point
- Reference Line – Enable (Yes) or disable (No) the reference line feature.
- Tag Attributes (single point and HMC4000) – Configure the tags that will contain the value being plotted. On an HMC2000, these are the options for a single point plot, on an HMC4000 these are the options for both the single and multi-point plots
- Point Color – Select a color for the point that will appear on the Plot
- X-Axis Tag Name – Specify the name of the tag containing the X coordinate of the point.
- Y-Axis Tag Name – Specify the name of the tag containing the Y coordinate of the point.
- Tag Attributes (HMC2000 only, multipoint) – Configure the tags that will contain the value being plotted. These options are only available on the HMC2000 multi-point plot
- Retain Data – Retain data after a power cycle. Tags created to hold the multipoint data will be assigned as retentive if selected.
- Action after memory is full – Options are FIFO (first in, first out, as data is read, the oldest data is discarded after the number of points is exceeded) and Stop Logging (once the number of data points specified has been read, the plot will stop logging new data points).
- Line color – Set the line color.
- Line Width – Sets line width.
- Number of points – Sets the number of points to be plotted. Maximum of 100 points allowed. Tags are automatically created in the HMC to hold the past data points when using multipoint.
- Plot Style – Choices include Data Point Only, Data Point with Line, and Line Only.
- Point Color – Select a color for the point that will appear on the Plot
- X-Axis Tag Name – Specify the name of the tag containing the X coordinate of the point.
- Y-Axis Tag Name – Specify the name of the tag containing the Y coordinate of the point.
- Value Scale Properties – Specify the data type and range for the X and Y axis of the plot
- X-Axis Data Type – Same data type options as the trend diagrams above (unsigned and signed integers, Hexadecimal, BCD, and Float)
- X-Axis Minimum Value – Specify the starting point of the X axis
- X-Axis Maximum Value – Specify the ending point of the X axis
- Y-Axis Data Type – Same data type options as the trend diagrams above (unsigned and signed integers, Hexadecimal, BCD, and Float)
- Y-Axis Minimum Value – Specify the starting point of the Y axis
- Y-Axis Maximum Value – Specify the ending point of the Y axis
Resize an XY Plot object
Move the mouse pointer over one of the resize handles. When the pointer changes to a double-headed arrow, simply click and drag to a new location.