
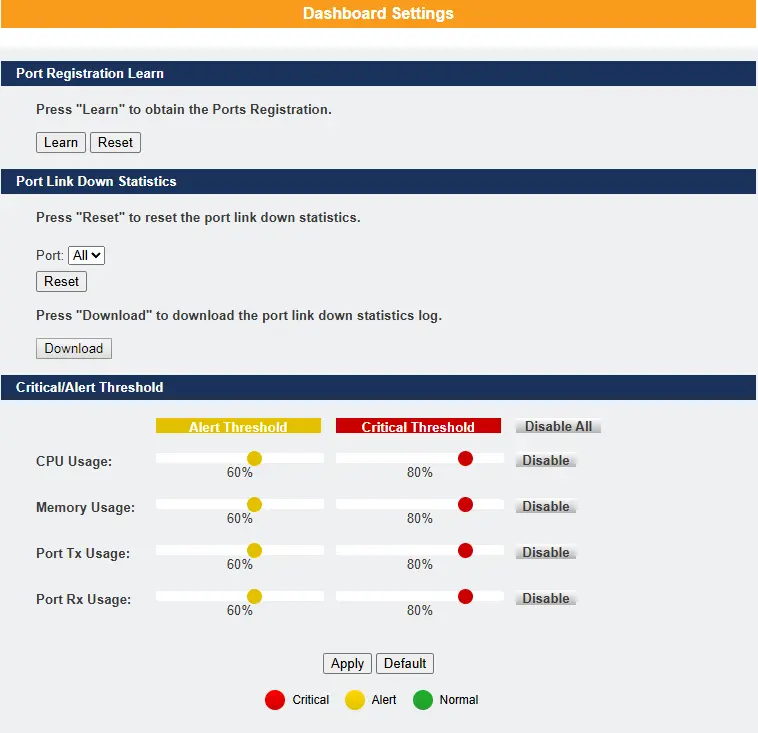
The Dashboard is an intelligent system that provides real-time switch parameters
including performance, link status and data traffic information in an engaging, easy-view
format for the end-user’s tricolor scheme as the Topology Map. The dashboard setting
enables you to control the performance of the switch like CPU, Memory, Port Tx Usage,
Port Rx Usage. Learn options to obtain port registration information.
System Information
| Parameter | Description |
|---|---|
| Learn | This field is to obtain the port registration information. |
| Reset | Reset option to reset the port registration information |
| Port | User can select individual port or all ports information to reset to default on registration information |
| Download | This field will download the statistics of port down information along with date time. |
| CPU Usage | User can configure threshold value to normal, alert, critical percentage or disable the feature |
| Memory Usage | User can configure threshold value to normal, alert, critical percentage or disable the feature |
| Port Tx Usage | User can configure threshold value to normal, alert, critical percentage of the interface Tx usage or disable the feature |
| Port Rx Usage | User can configure threshold value to normal, alert, critical percentage of the interface Rx usage or disable the feature |
| Apply | This field is used for apply the changes made |
| Default | This field will make the Switch to default values. |