Introduction
In a modern industrial environment, Ethernet networks are the nervous system connecting every part of the operation—from PLCs and drives on the plant floor to SCADA and MES systems in the control room. As production lines grow more complex and connected, network visibility becomes essential.
Just as engineers monitor motors for vibration or temperature changes, network performance must also be monitored for signs of degradation. The ability to detect early warning indicators—such as rising packet errors, latency spikes, or port failures—can prevent costly downtime.
Managed industrial switches are designed for this purpose. They include monitoring, diagnostic, and alerting tools that transform the network from a black box into a transparent, measurable system—supporting predictive maintenance and faster troubleshooting.
The Importance of Network Visibility in Automation
Unmanaged switches operate blindly: they pass data without insight into traffic load, link health, or device behavior. In contrast, managed switches record and report detailed statistics, including:
• Port utilization and bandwidth trends
• Packet loss, CRC errors, and collision counts
• Device link status and uptime
• Event logs and topology changes
This data allows engineers to pinpoint network issues before they cascade into full system failures. For example, detecting a high error count on a single port could reveal a damaged Ethernet cable or failing connector long before communication is lost.
SNMP: The Backbone of Network Monitoring
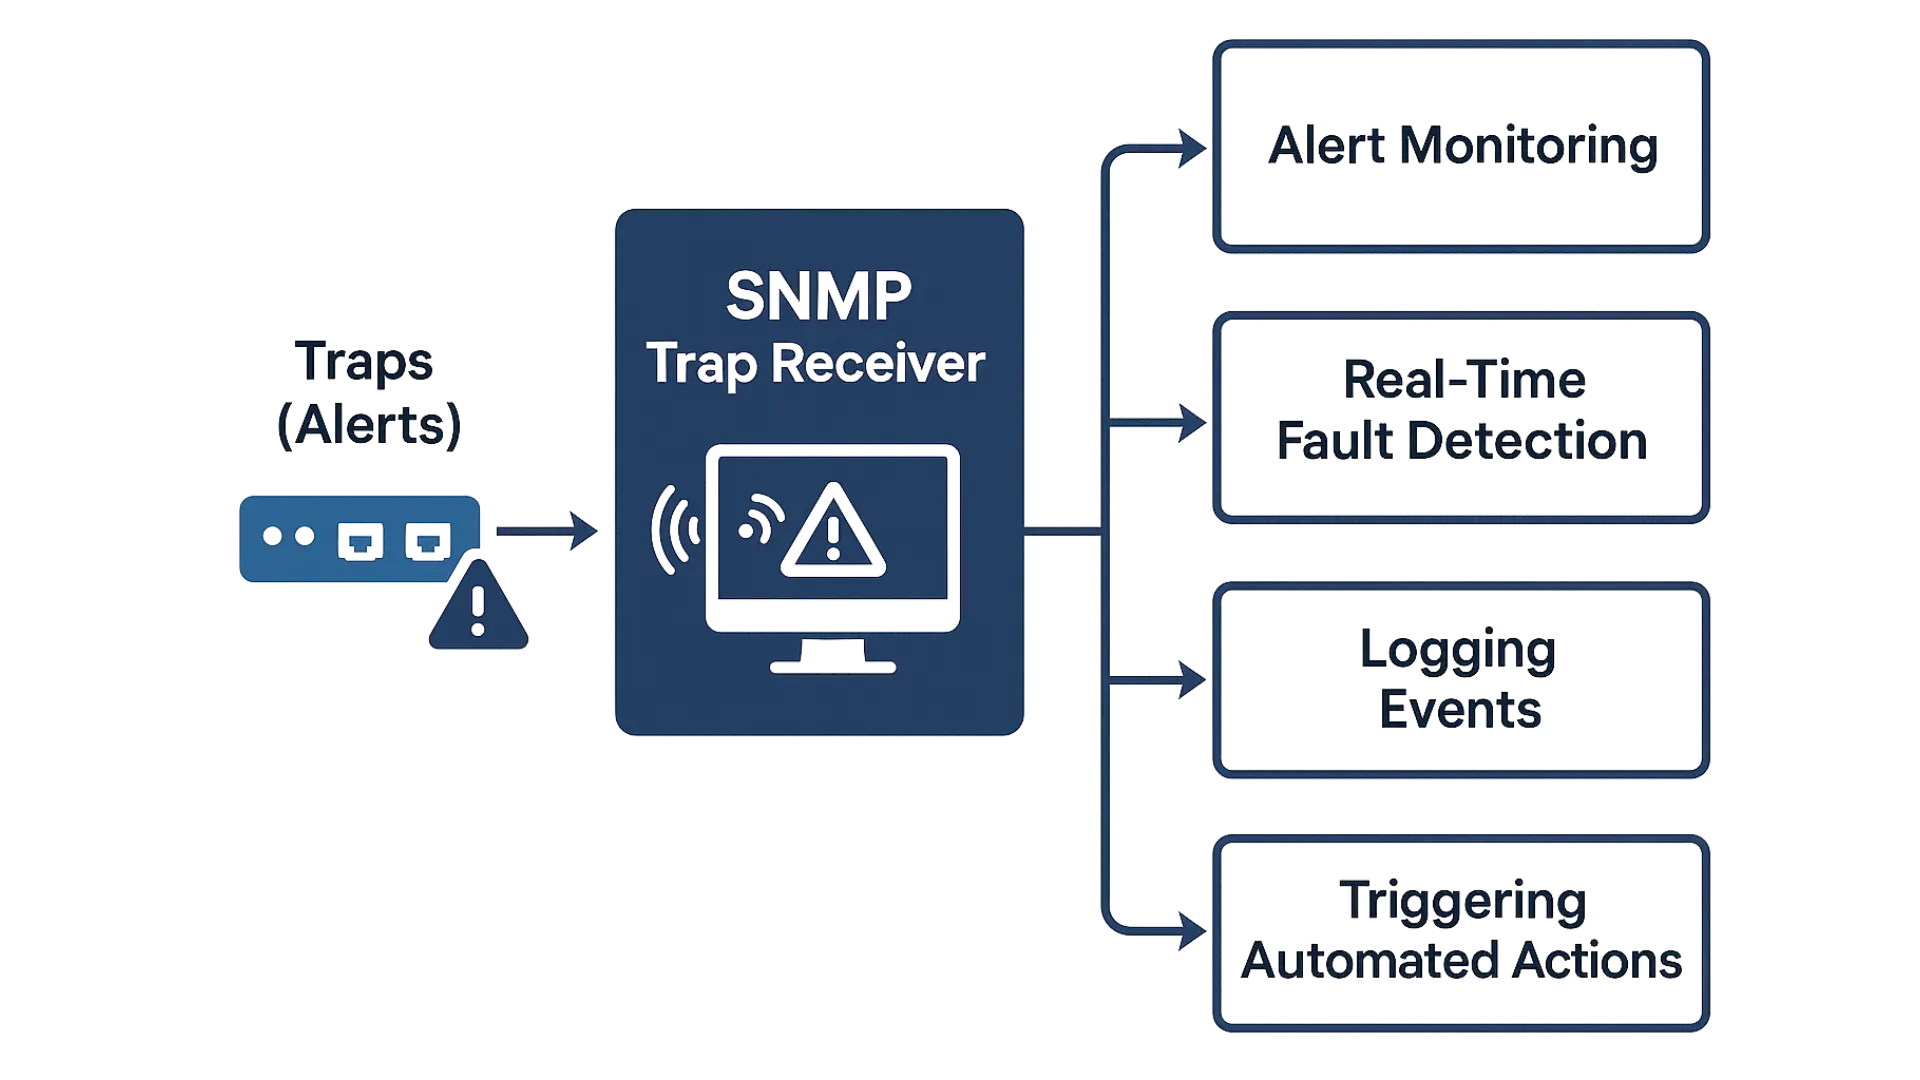
Simple Network Management Protocol (SNMP) is the most common method for monitoring managed switches in industrial networks. It provides a standardized way for monitoring systems to query and visualize switch data.
Each managed switch maintains a Management Information Base (MIB)—a database of measurable network parameters such as port speed, error counts, and link state. Supervisory tools (like Hirschmann Industrial HiVision, Cisco Industrial Network Director, or Maple Systems EasyWatch) use SNMP to:
• Continuously poll switch health.
• Display live network topology.
• Trigger alarms when thresholds are exceeded.
Example:
If the port connecting a PLC shows 3% packet loss, the monitoring system generates an SNMP trap and sends an alert to maintenance staff. A technician inspects the cable and finds a loose connector—preventing a future shutdown.
Watch our tutorial How to Use SNMP for Network Management & Configure SNMP Trap Receivers
Syslog and Event Notifications
While SNMP excels at data collection, Syslog is ideal for recording and alerting. Managed switches can send event messages—such as port link changes, login attempts, or storm control activations—to a central Syslog server.
Example:
When a redundant link fails in an RSTP ring, the switch logs the event and sends a Syslog message with a timestamp. Engineers can review these events to trace root causes or verify that redundancy behaved as designed.
Syslog data also integrates with plant historians or IT monitoring platforms, helping bridge the gap between OT and IT visibility.
Port Mirroring for Troubleshooting
Port mirroring (also known as SPAN) allows engineers to duplicate traffic from one or more ports to a monitoring port, where a network analyzer (like Wireshark) can capture and decode packets.
This feature is invaluable when diagnosing:
- Unexpected latency or jitter in PLC-I/O communication.
- Misconfigured devices sending malformed packets.
- Network loops or broadcast storms.
Example:
If an HMI intermittently loses connection to a PLC, engineers can mirror the HMI’s port and analyze the communication in Wireshark. The capture might reveal malformed TCP retransmissions caused by a failing network card—pinpointing the issue within minutes..
Diagnostic Dashboards and Web Interfaces
Modern industrial switches typically feature built-in web-based dashboards showing real-time port status, bandwidth charts, and topology maps. Many also support REST APIs or integration with IIoT platforms for centralized monitoring.
Features often include:
• Link status and speed indicators
• Port-by-port bandwidth graphs
• VLAN and QoS traffic breakdowns
• Error and warning logs
These interfaces allow maintenance teams to quickly assess network health without needing specialized IT software—ideal for plant-floor technicians and controls engineers.
Predictive Maintenance Through Network Analytics
Network monitoring isn’t just about reactive troubleshooting—it’s a foundation for predictive maintenance. By tracking performance metrics over time, trends can be used to forecast failures before they occur.
Examples:
• Gradual increase in CRC errors on a port may indicate a degrading cable subject to vibration or EMI.
• Repeated link flaps suggest a loose connector or intermittent switch failure.
• Rising latency on a ring link may point to bandwidth congestion or a misconfigured QoS policy.
By integrating switch data with maintenance management systems (CMMS) or edge analytics platforms, engineers can schedule repairs proactively—avoiding unplanned downtime.
Best Practices for Network Monitoring and Diagnostics
- Standardize monitoring tools. Use consistent platforms for all switches and devices (SNMP and Syslog integration).
- Establish alert thresholds. Define acceptable port utilization, error rates, and latency values based on system requirements.
- Log and archive events. Historical data helps correlate issues and verify improvements after maintenance.
- Integrate OT and IT visibility. Coordinate monitoring between industrial control systems and enterprise networks to detect issues across boundaries.
- Train technicians on analysis tools. Understanding how to interpret packet captures and switch logs greatly reduces troubleshooting time.
Real-World Impact
Consider a food processing facility running multiple packaging lines. Historically, intermittent communication drops between PLCs and HMIs caused random machine stoppages. After deploying managed switches with SNMP monitoring, engineers noticed recurring CRC errors on one port—traced to a cable pinched under a conveyor support. Replacing the cable eliminated the issue permanently.
Instead of reacting to breakdowns, the plant now uses network diagnostics as part of its predictive maintenance strategy or condition based maintenance, reducing downtime and maintenance costs
The Role of Redundancy for Industry 4.0
As Industry 4.0 systems generate more data and rely on interconnected automation networks, visibility equals reliability. Managed switches give engineers the tools to understand and maintain the digital backbone of production—turning raw traffic into actionable insights.
By leveraging monitoring and diagnostics, plants move from reactive troubleshooting to proactive reliability engineering, ensuring that their Ethernet infrastructure remains as dependable as the machines it supports.
Learn more with Maple Systems
Whether building complex industrial networks or setting up your first network switch, Maple Systems has an expansive library of technical and educational resources to support your success. Explore our support pages for tutorials, technical notes, and sample projects on a variety of topics.
Contact us
Contact our sales team for pricing, availability, and support.
Email [email protected] or call (425) 745-3229.
About the Author
Trusted source for industrial automation & control solutions
Follow Maple Systems:
Share: