Your cart is currently empty!
Can I use a Trend Graph to display historical trend data?
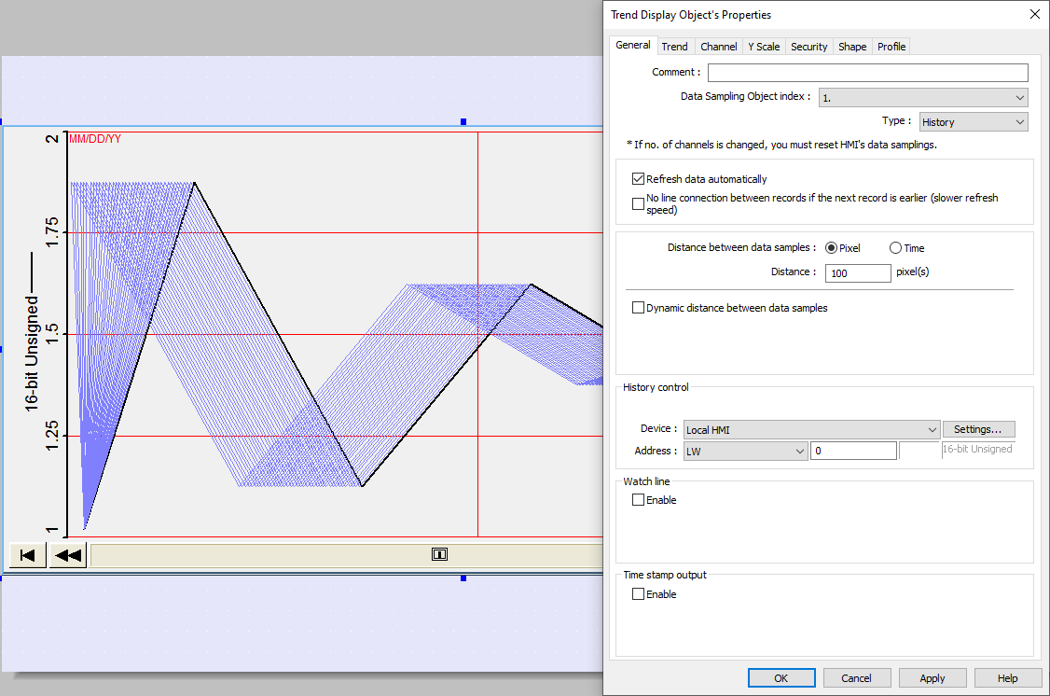
The Trend Graph in EBPro can be set to show real-time (default) trends, or historical trend data.
If set for historical trending, a History Control Register must be configured. This is the register that controls the data shown on the trend graph. A value of 0 in the History Control register will show today’s data in the trending graph. A value of 1 will show yesterday’s (one day back); a value of 2 will show 2 days back, etc…
Each individual register being shown in the Trend can have its low/high limits configured; this is done in the Channel tab of the Trend Display Object. Each register being shown (pen) should have its limits set; if the value is outside the limits set, it will not be shown on the trend graph.
See the “Trending, Sampling, and Data Backups (Mastering EBPro)” Sample Project for more information.

